
AKG weekly charts - Issue #103
AKG weekly charts - Issue #103
This newsletter is a weekly selection of 10 charts hand-picked across the internet which pertains to our investment strategy and bring an updated insight and perspective.


Connect on various social media platforms here
Subscribe to (free) AKG weekend readings newsletter here
Summary of financial markets in last week here
Follow #FCOTTReco and #FCBookReco on our Twitter page here.
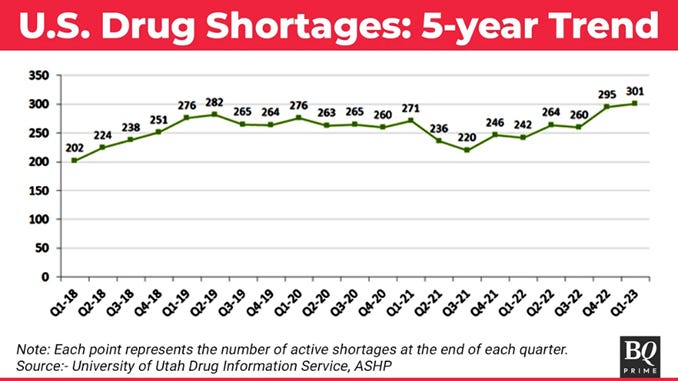
[1] Drug Shortages can occur for many reasons, including manufacturing and quality problems, delays, and discontinuations. Manufacturers provide FDA most drug shortage information, and the agency works closely with them to prevent or reduce the impact of shortages. The 5-yr trend has been again rising on the upside since the Covid phase is over.
Will the Indian companies exporting to US take benefit in time?
[2] Germany finds itself ill-suited to sustainably serve the energy needs of its industrial base; overly dependent on old-school engineering; and lacking the political and commercial agility to pivot to faster-growing sectors.
And as we said earlier (see here), the ATHs on DAX is misleading.

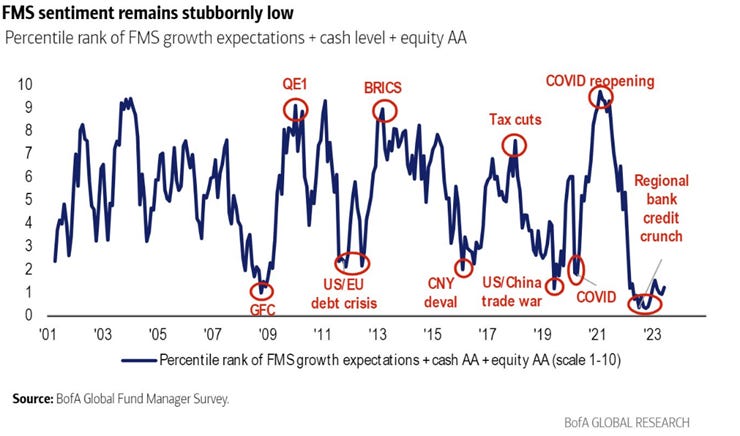
[3] The pain trade for money managers is still a rally in stocks that would catch them flatfooted. Fundamentally Fund manager sentiment survey indicates that asset allocators saying we need (a) meaningful downward surprise to rates, and/or (a) meaningful upward surprise to growth (no recession).
[4] The move towards renewables is accelerating….

[5] Individual investor sentiment had risen "with frothy stocks as investors chase the bull". U.S. stocks have seen $38 billion in inflows in the last three weeks, the strongest momentum since Oct. 2022, while tech funds have seen $19 billion flow in in the last eight weeks, the strongest momentum since March 2021.

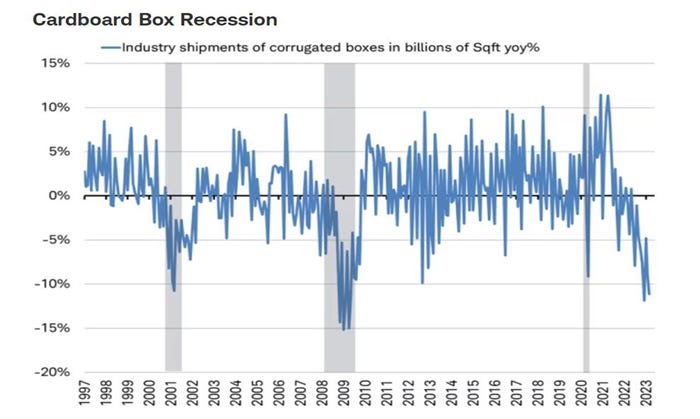
[6] Indicators such as industrial production, worldwide trade volumes, job growth by industry, surveys of purchasing managers at manufacturing companies, and others and refers to the phenomenon as a “cardboard box recession.” It suggests the mild recession in corporate earnings could continue.
[7] Expected returns like the ones shown below are used by asset allocators in setting long-term strategic asset allocation benchmarks. Thus while the absolute level of the individual expected return of each asset class is interesting and relevant, the relativities often provide the most interesting and compelling influence on asset allocation decisions and ultimate portfolio mixes. For example stocks vs fixed income, cash vs bonds, global vs US.

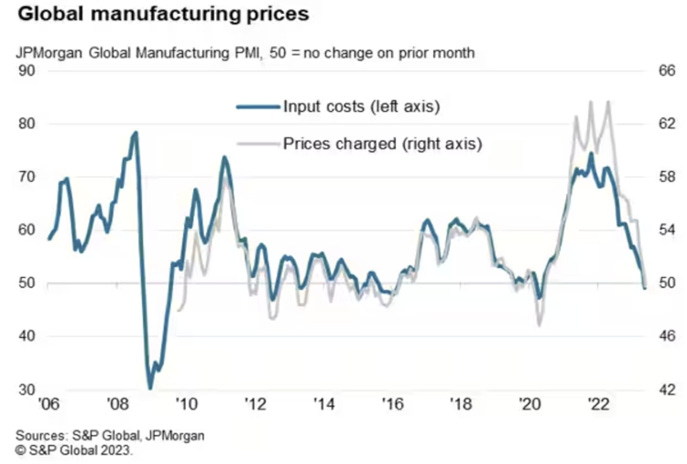
[8] April saw rates of increase in average input costs and selling prices ease to their lowest since June 2020 and September 2020, respectively. Both price measures in global manufacturing prices signalled slower inflation in the consumer and investment goods sectors (with the steeper increases in the latter) in contrast to the declines registered in the intermediate goods category.
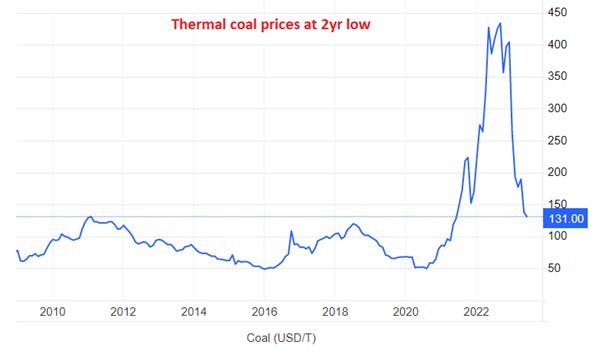
[9] The benchmark Newcastle thermal coal future prices have fallen to US$131/ton, the lowest price since June 2021. Though the current prices are down over 70% from the highs witnessed in September 2022; these are still materially higher from the pre covid 10yr average of close to US85/ton.
Interestingly, while “peak oil” has been a regular topic of discussion amongst the market participants, the discussion on “peak coal” is not that popular.
[10] High correlation between Fed net QE and the S&P500 suggests that Fed liquidity is a crucial driver of the stock market. With the Fed turning more hawkish and continuing QT, the downside risks to equities are growing.

Disclaimer:
This newsletter is for information and educational purposes only. In this material, Amit Kumar Gupta (SEBI registered Research Analyst, INH100009327) has used information that is publicly available and is believed to be from reliable sources. While utmost care has been exercised, the author does not warrant the completeness or accuracy of the information and disclaims all liabilities, losses and damages arising out of the use of this information. Readers, before acting on any information herein should make their own investigation & seek appropriate professional advice. Any sector(s)/ stock(s)/ issuer(s) mentioned do not constitute any recommendation and the RA may or may not have any future or existing position in these. All opinions/ figures/ charts/ graphs are as on date of publishing (or as at mentioned date) and are subject to change without notice. Any logos used may be trademarks™ or registered® trademarks of their respective holders, our usage does not imply any affiliation with or endorsement by them. Past performance on charts may or may not be sustained in the future and should not be used as a basis for comparison to infer any investment ideas.