
AKG weekly charts - Issue #104
AKG weekly charts - Issue #104
This newsletter is a weekly selection of 10 charts hand-picked across the internet which pertains to our investment strategy and bring an updated insight and perspective.


Connect on various social media platforms here
Subscribe to (free) AKG weekend readings newsletter here
Summary of financial markets in last week here
Follow #FCOTTReco and #FCBookReco on our Twitter page here.
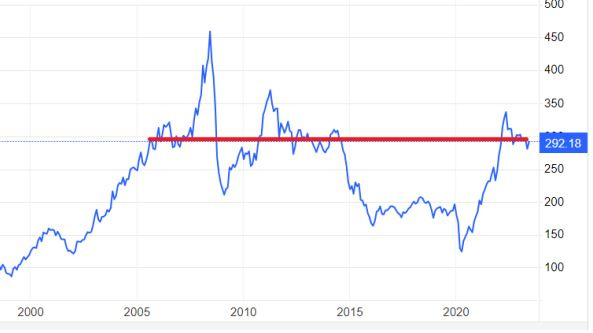
[1] Global commodities (measured by CRB index) are back to 2005 levels as China data continue to disappoint. The unlock trade in China brought some momentum but it is back to square one.
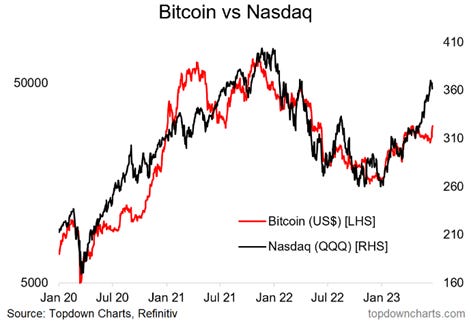
[2] A lot of things happening in Bitcoin world. Old exchanges getting blocked, new exchanges being floated and ETFs being launched. The risk on situation has brought NASDAQ rally of ~30% YTD. Will Bitcoin move in same direction in H2CY23?
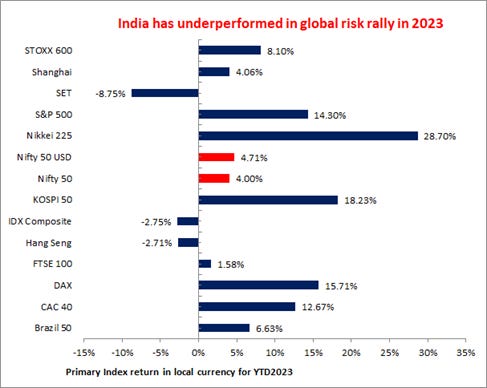
[3] Indian markets have sharply underperformed the most emerging market peers and developed markets in the past six months. Note that in 2022 India was one of the top performing global markets. This is in spite of net foreign flows being positive in the past six months to the tune of Rs500bn (vs Rs1256bn outflows for 2022).
[4] Germany is so messed up in charts!
The ZEW Indicator of Economic Sentiment has dropped noticeably and currently points to an unchanged economic situation for the next six months. Economic expectations are negatively affected by several factors. Experts expect banks to be more cautious in granting loans. The still high inflation rates and the internationally restrictive monetary policy are also weighing on the economy

[5] China has been cutting rates to stimulate economy. Post-Covid reopening appeared to have “fizzled out” in the second quarter as growth has been downgraded by many economists and brokerages. Given the stress in housing and consumption in China, expect more such measures in the coming months.

[6] The SMID rally has finally taken bit of a breather in the past few trading sessions with most technical indicators showing overbought conditions. Some consolidation and a monsoon update will be critical for the next leg up. Be positive but selectively.

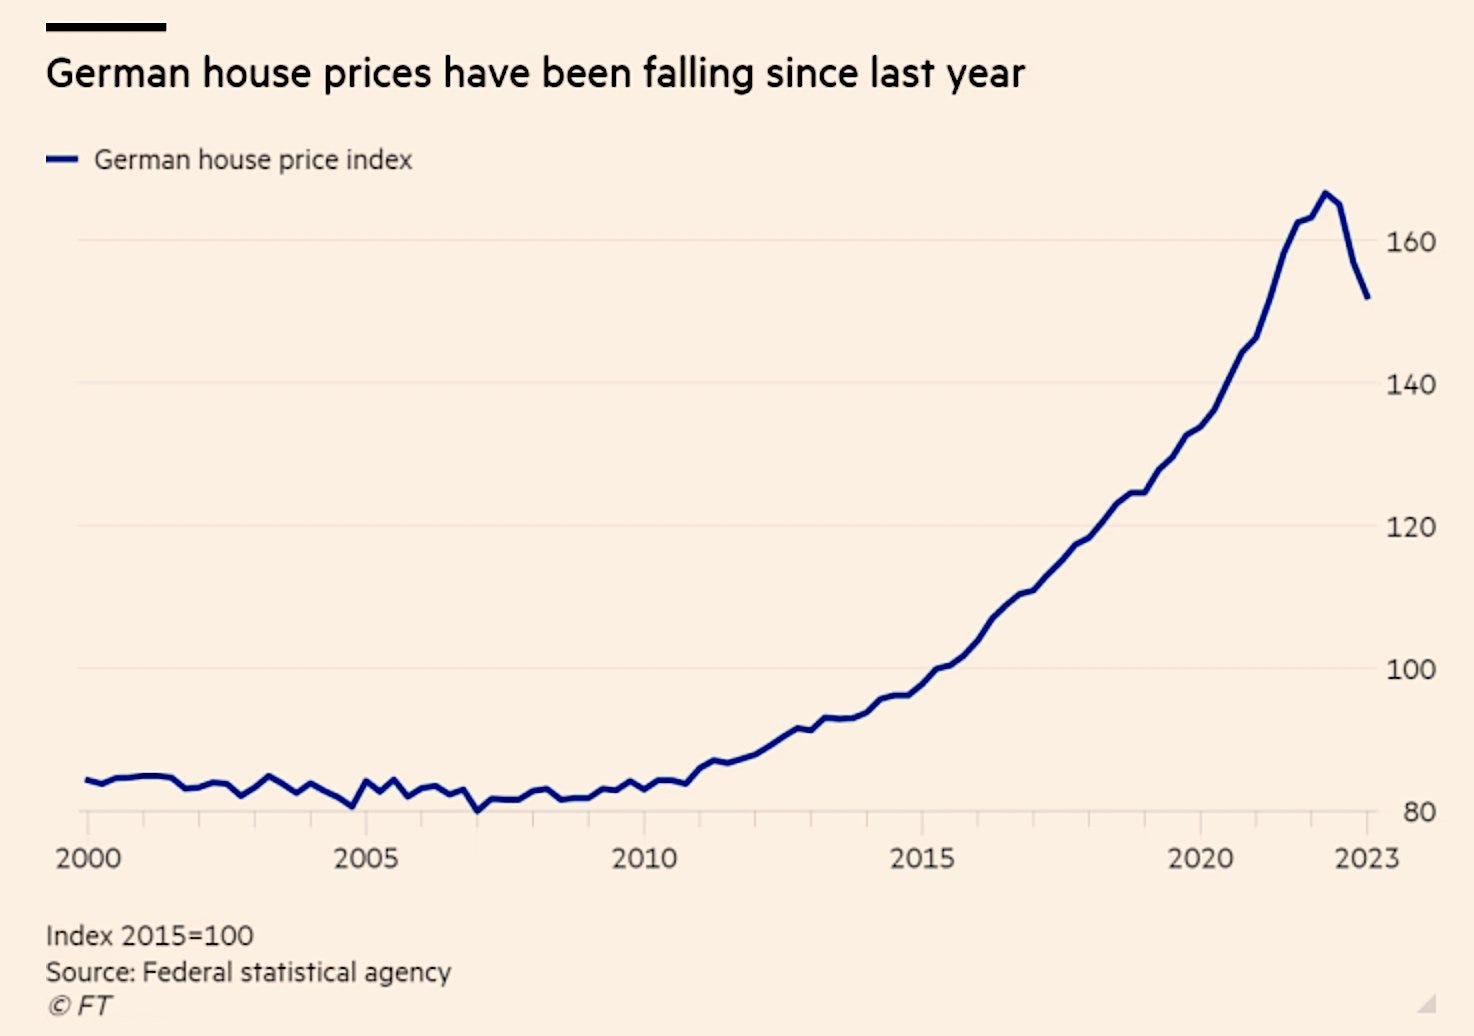
[7] German house prices fall by record 6.8% in Q1 2023 YoY as higher mortgage costs deter buyers. The German housing market has gone from being a seller’s market to a buyer’s market, and transactions have almost come to a standstill
[8] India’s stock market spikes as investors increasingly embrace the narrative that the country is set to overtake China as the world’s economic growth engine & it helps that India doesn’t have the geopolitical risks swirling around China.

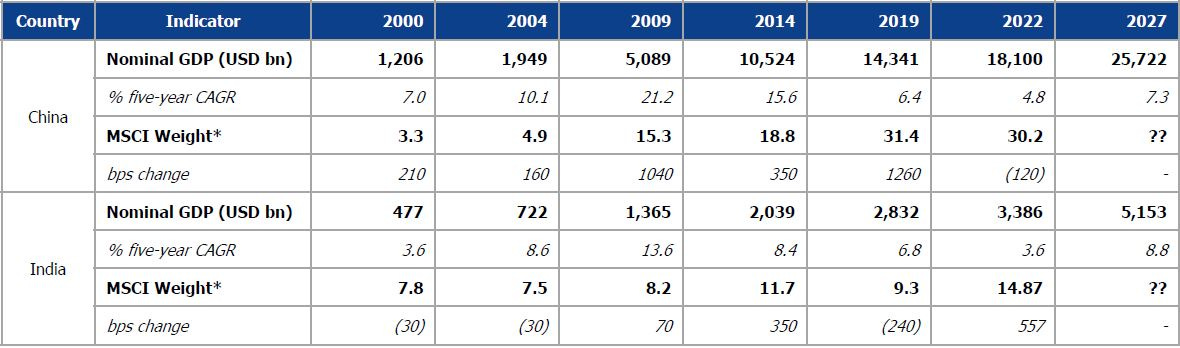
[9] China’s move from a USD 1.2tn economy to a USD 5tn economy in 2009 saw its weight in the MSCI Index rise ~5x from 3.3% in 2000 to 15.3%. Overall, through 2000 to pre Covid period (CY19), i.e., in the two decades, China’s average five year CAGR growth has been 12%, which pushed its MSCI Index up by 9.5x from 3.3% to 31.4%.
In the two decades from 2000 to 2019, India’s economy grew 6x, while its weightage in the MSCI increased 150bps. This with domestic reforms and large consumer market (due to growing population) would spike its weights in MSCI indices if India were to achieve its growth potential.
Source : Elara Securities.
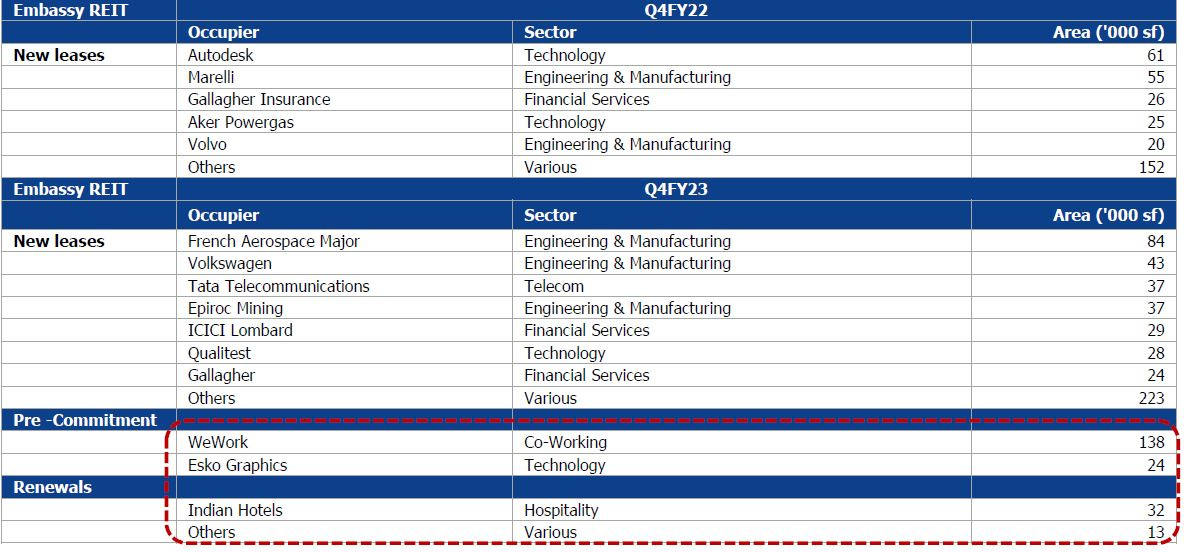
[10] REITs leases indicate pick up in GCC hiring…
Embassy REIT lease data shows pick up in non technology companies’ leasing in Q4FY23
Source : Elara Securities.
Disclaimer:
This newsletter is for information and educational purposes only. In this material, Amit Kumar Gupta (SEBI registered Research Analyst, INH100009327) has used information that is publicly available and is believed to be from reliable sources. While utmost care has been exercised, the author does not warrant the completeness or accuracy of the information and disclaims all liabilities, losses and damages arising out of the use of this information. Readers, before acting on any information herein should make their own investigation & seek appropriate professional advice. Any sector(s)/ stock(s)/ issuer(s) mentioned do not constitute any recommendation and the RA may or may not have any future or existing position in these. All opinions/ figures/ charts/ graphs are as on date of publishing (or as at mentioned date) and are subject to change without notice. Any logos used may be trademarks™ or registered® trademarks of their respective holders, our usage does not imply any affiliation with or endorsement by them. Past performance on charts may or may not be sustained in the future and should not be used as a basis for comparison to infer any investment ideas.