
AKG weekly charts - Issue #107
AKG weekly charts - Issue #107
This newsletter is a weekly selection of 10 charts hand-picked across the internet which pertains to our investment strategy and bring an updated insight and perspective.

Connect on various social media platforms here
Subscribe to (free) AKG weekend readings newsletter here
Summary of financial markets in last week here
Follow #FCOTTReco and #FCBookReco on our Twitter page here.
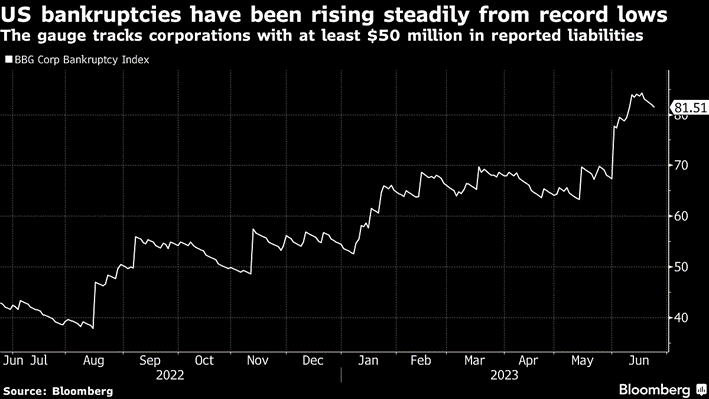
[1] US bankruptcies in the first six months of 2023 were the highest since 2010 among the companies covered by S&P Global Market Intelligence as per Bloomberg. One layer below the benchmark indices are all recession like conditions!
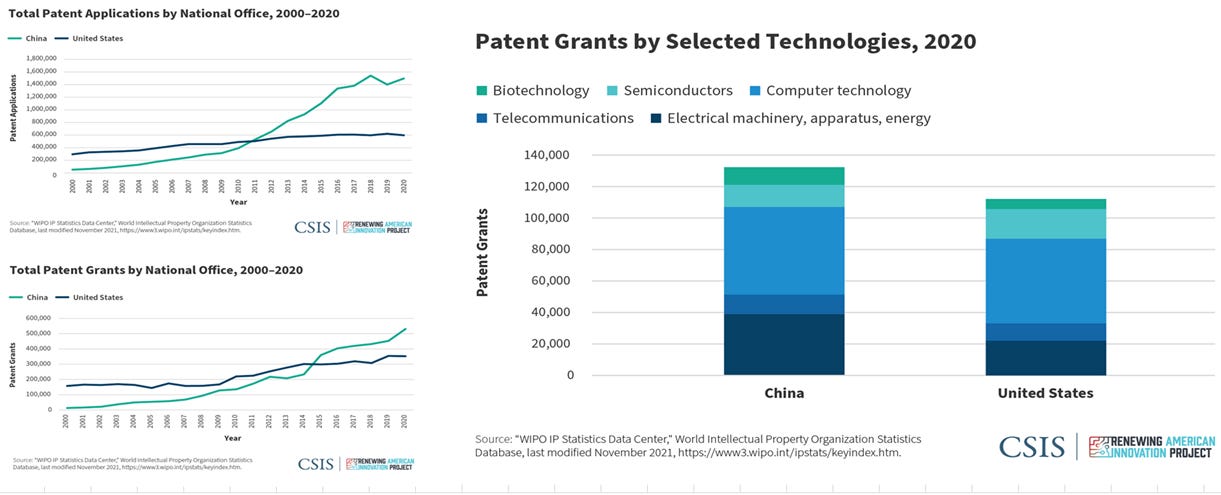
[2] On the technology front, the US has been steadily losing its edge over China in the past couple of decades. In 2020, China filed 2.5x more patents than the US and was granted 50% more patents than the US. In particular, China led the patents in the field of Biotechnology and Energy. Read more here. (Source : CSIS)
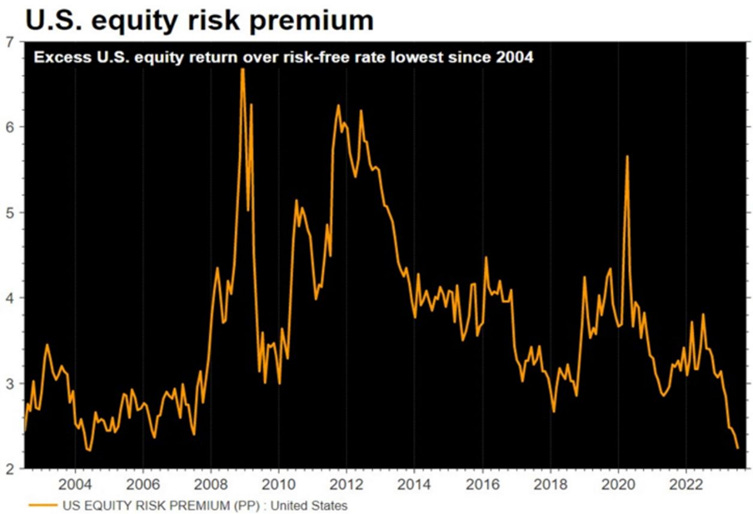
[3] The equity investors are taking cognizance of tech and pharma trends of US losing its leadership edge and are de-rating the US stocks. The current risk premium for US equities is the lowest since 2004. (Source : Bloomberg)
[4] Rice prices have surged to multi-year highs. And with global rice inventories projected to fall to 6-year lows in the next 6 months, prices could go even higher. Indian rice stocks have been hitting 52w highs in the light of rice export ban in India (see here)

[5] The Monsoon has been terribly uneven across the country. All those blue coloured areas have had excess rainfall, so far. And the red coloured areas have deficient rainfall. Climate change conditions can’t be more stark - El-nino, floods, famine and cyclones - all within last 45 days.

We have initiated a new position in a lending financer recently in our ‘Special Situation’ Strategy. The company has undergone complete management overhaul in the last 4yrs and is now looking to sell stake in a subsidiary which will generate cash flows equivalent to ~6% of its market cap. The company has also declared a dividend after a gap of many years. It's proactive approach in optimizing returns from its current investments reflects its commitment to maximizing profitability and capitalizing on market conditions.
An initiating coverage report is available for fintrekk subscribers.
To subscribe to such reports, please visit : https://fintrekkcapital.com/#subscription
For full disclosure/disclaimers, please visit : https://fintrekkcapital.com/disclosures
[6] In emerging markets, a 10% dollar appreciation decreases economic output by 1.9% after 1 year & the drag lingers for 2½ years. The negative effects in advanced economies are smaller, peaking at 0.6% after one quarter & are largely gone in a year
Read more in the blog by IMF here.
[7] China is slowing down as indicated by GDP forecasts. But the reasons are not clear to many. But here is a terrifc interview of Louis-Vincent Gave from Gavekal Research outlining the implosion of China and how India (along with other EMs) can benefit from it. This downtrend of China looks quite sustainable for few years!

[8] Over the past 40 years, gold has increased an average of 34% during an easing cycle following the last rate hike of a tightening cycle vs. an average of 7% during periods of tightening. Time for a trade in Gold? (Source : TD securities)

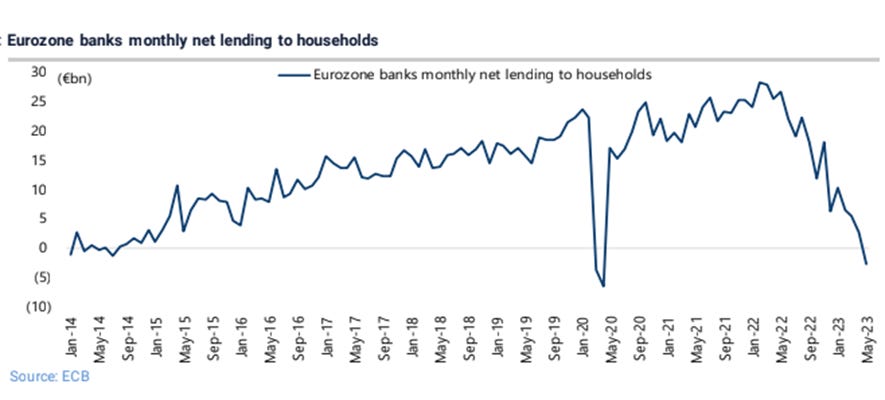
[9] Banks in Europe have already warned they expect to tighten access to credit even further this quarter, responding to higher funding costs and general caution given sluggish economic growth. Net lending to households have collapsed in the H1CY2023.
[10] Coming Friday, NASDAQ index will undergo a unique rebalancing where the combined account for top 5 stocks (Microsoft, Apple, Amazon, Tesla and Nvidia) - 43.8% weight in the index, according to Refinitiv data, will come down to 38.5%. Clearly AI theme is dominating headlines, market share and indices share!

Disclaimer:
This newsletter is for information and educational purposes only. In this material, Amit Kumar Gupta (SEBI registered Research Analyst, INH100009327) has used information that is publicly available and is believed to be from reliable sources. While utmost care has been exercised, the author does not warrant the completeness or accuracy of the information and disclaims all liabilities, losses and damages arising out of the use of this information. Readers, before acting on any information herein should make their own investigation & seek appropriate professional advice. Any sector(s)/ stock(s)/ issuer(s) mentioned do not constitute any recommendation and the RA may or may not have any future or existing position in these. All opinions/ figures/ charts/ graphs are as on date of publishing (or as at mentioned date) and are subject to change without notice. Any logos used may be trademarks™ or registered® trademarks of their respective holders, our usage does not imply any affiliation with or endorsement by them. Past performance on charts may or may not be sustained in the future and should not be used as a basis for comparison to infer any investment ideas.