
AKG weekly charts - Issue #115
AKG weekly charts - Issue #115
This newsletter is a weekly selection of 10 charts hand-picked across the internet which pertains to our investment strategy and bring an updated insight and perspective.

Summary of financial markets in last week (11-15 Sept) here
Connect on various social media platforms here
Interaction on Special Situation Investing with Trinkerr here
Aug 2023 review for our equity research strategies here and here
Subscribe (free) to #AKGweekendreadings here [released every Friday evening]
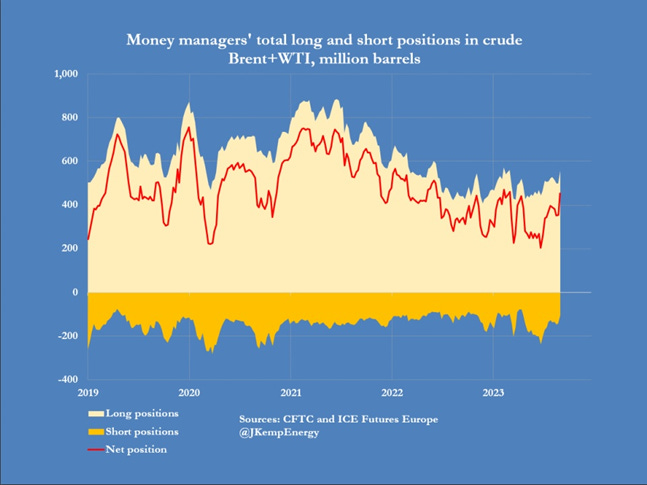
[1] Net long positions in crude oil have reached their highest level since October of last year as $100 looms large. This adds to the inflation worries and help the central bank’s ‘higher for longer’ narrative.
[2] Defence has been an enormous wealth generator to those investors who were early in the cycle in 2022 but things clearly have gone overboard. No one denies the long term story in this space but here is a food for thought: Defence exports need to grow at 45% CAGR over next 3yrs to achieve 5-yr target of US5bn$ set by GOI in 2020. Defence production may still catch up but will exports grow at that pace?

[3] Dollar index has given 9 consecutive positive weekly close. Equity bears are using this to scare the stubborn bulls out of their positions. Equity bulls are seeing the resistance at 106.00-106.30 to start another risk-on rally for equities post consolidation. Will the Fed provide the trigger in the FOMC meeting this week?

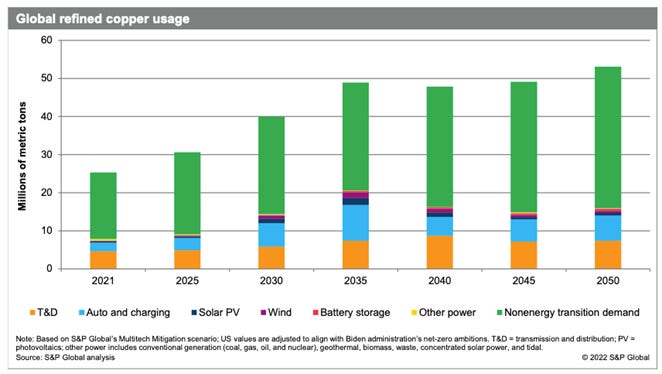
[4] The global refined copper usage is expected to double over the next three decades for non-energy transition demand. It will be interesting to see how this evolves over the years. Positive for metals/commodities.
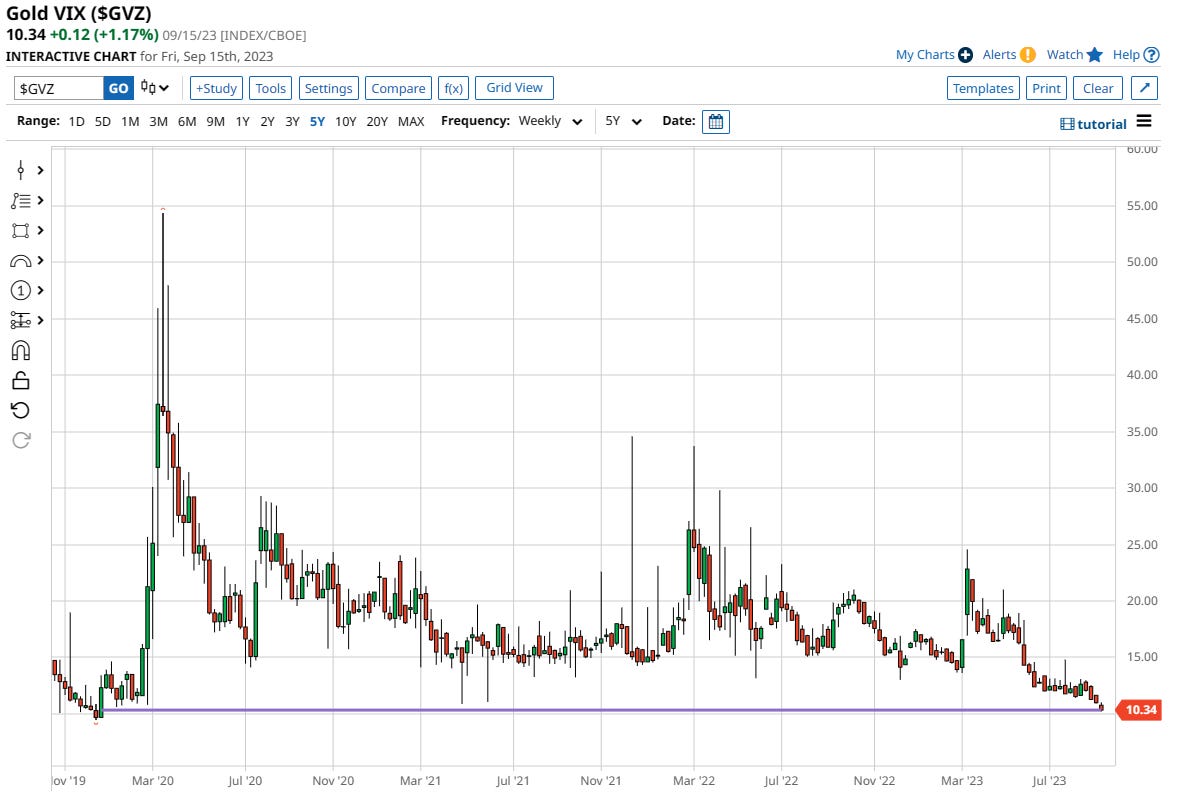
[5] Gold VIX at multi-year lows. Gold has been stagnating for months now despite all potential negative news. As we head into a volatile period for equities and seasonally strong period for Gold, can we see some strong moves as VIX bounces from these extreme oversold readings?
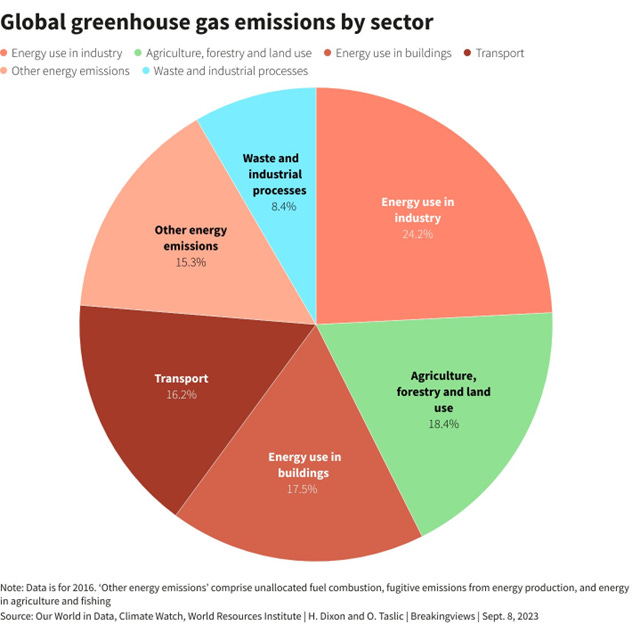
[6] Sectors such as power, transportation and industry, which contribute the largest to global CO2 emissions, should make deeper decarbonization efforts and increase the proportion of renewable energy consumption.
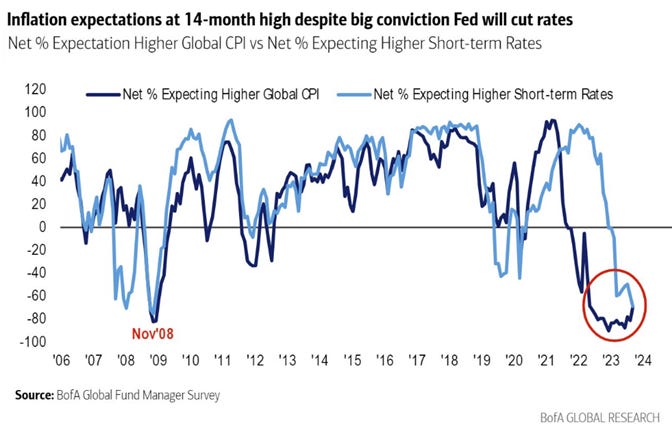
[7] Thanks to renewed spike in crude and food inflation, expectations for inflation are at 14-m high despite great conviction that Fed will cut rates in H1CY2024. Both are contra indicators to each other - Either Inflation comes down significantly or Fed stays put at rates longer than required.
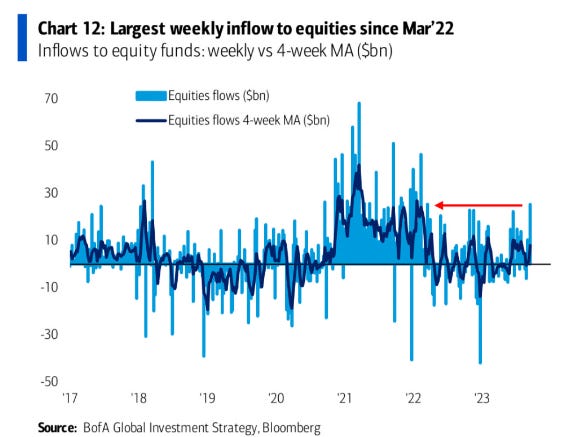
[8] Inflation rising is not detering equity Bulls across the world. Last week saw highest weekly equity inflows since March 2022. Signs of a euphoric top or another cycle post consolidation?
[9] The turn of the Microfinance industry post second wave of covid in 2021 has been solid despite K-shaped recovery. The faster growth in AUM and disbursments clearly demonstrates resilience.
Disc : Our MFI pick in FC wealth compounders product has been 2.5x since initiation. We believe the cycle has legs to go and will remain good till FY25 with the company delivering 25% growth. Check out our subscription plans here.

[10] US tech stocks after a torrid 2022 are crushing the other parts of equity market given stupendous returns. They are already trading way above 1SD despite rate hike cycle gaining momentum, thanks to AI-led developments. But are we reaching a climax of that rally with these extremly overbought conditions?

Disclaimer:
This newsletter is for information and educational purposes only. In this material, Amit Kumar Gupta (SEBI registered Research Analyst, INH100009327) has used information that is publicly available and is believed to be from reliable sources. While utmost care has been exercised, the author does not warrant the completeness or accuracy of the information and disclaims all liabilities, losses and damages arising out of the use of this information. Readers, before acting on any information herein should make their own investigation & seek appropriate professional advice. Any sector(s)/ stock(s)/ issuer(s) mentioned do not constitute any recommendation and the RA may or may not have any future or existing position in these. All opinions/ figures/ charts/ graphs are as on date of publishing (or as at mentioned date) and are subject to change without notice. Any logos used may be trademarks™ or registered® trademarks of their respective holders, our usage does not imply any affiliation with or endorsement by them. Past performance on charts may or may not be sustained in the future and should not be used as a basis for comparison to infer any investment ideas