
AKG weekly charts - Issue #128
AKG weekly charts - Issue #128
This newsletter is a weekly selection of 10 charts hand-picked across the internet which pertains to our investment strategy and bring an updated insight and perspective.

Summary of financial markets in last week here.
Connect on various social media platforms here
Subscribe (free) to #AKGweekendreadings here [released every Friday evening]
[1] Uranium is now at 17-yr high. Demand is going up and there is shortage. World is pushing up for Nuclear fuel!

[2] Investors in China are throwing in the towel on Chinese Stocks and instead opting to invest in foreign stocks. Last month, a record high $2 billion left China and was deployed to ETFs tracking foreign benchmarks.

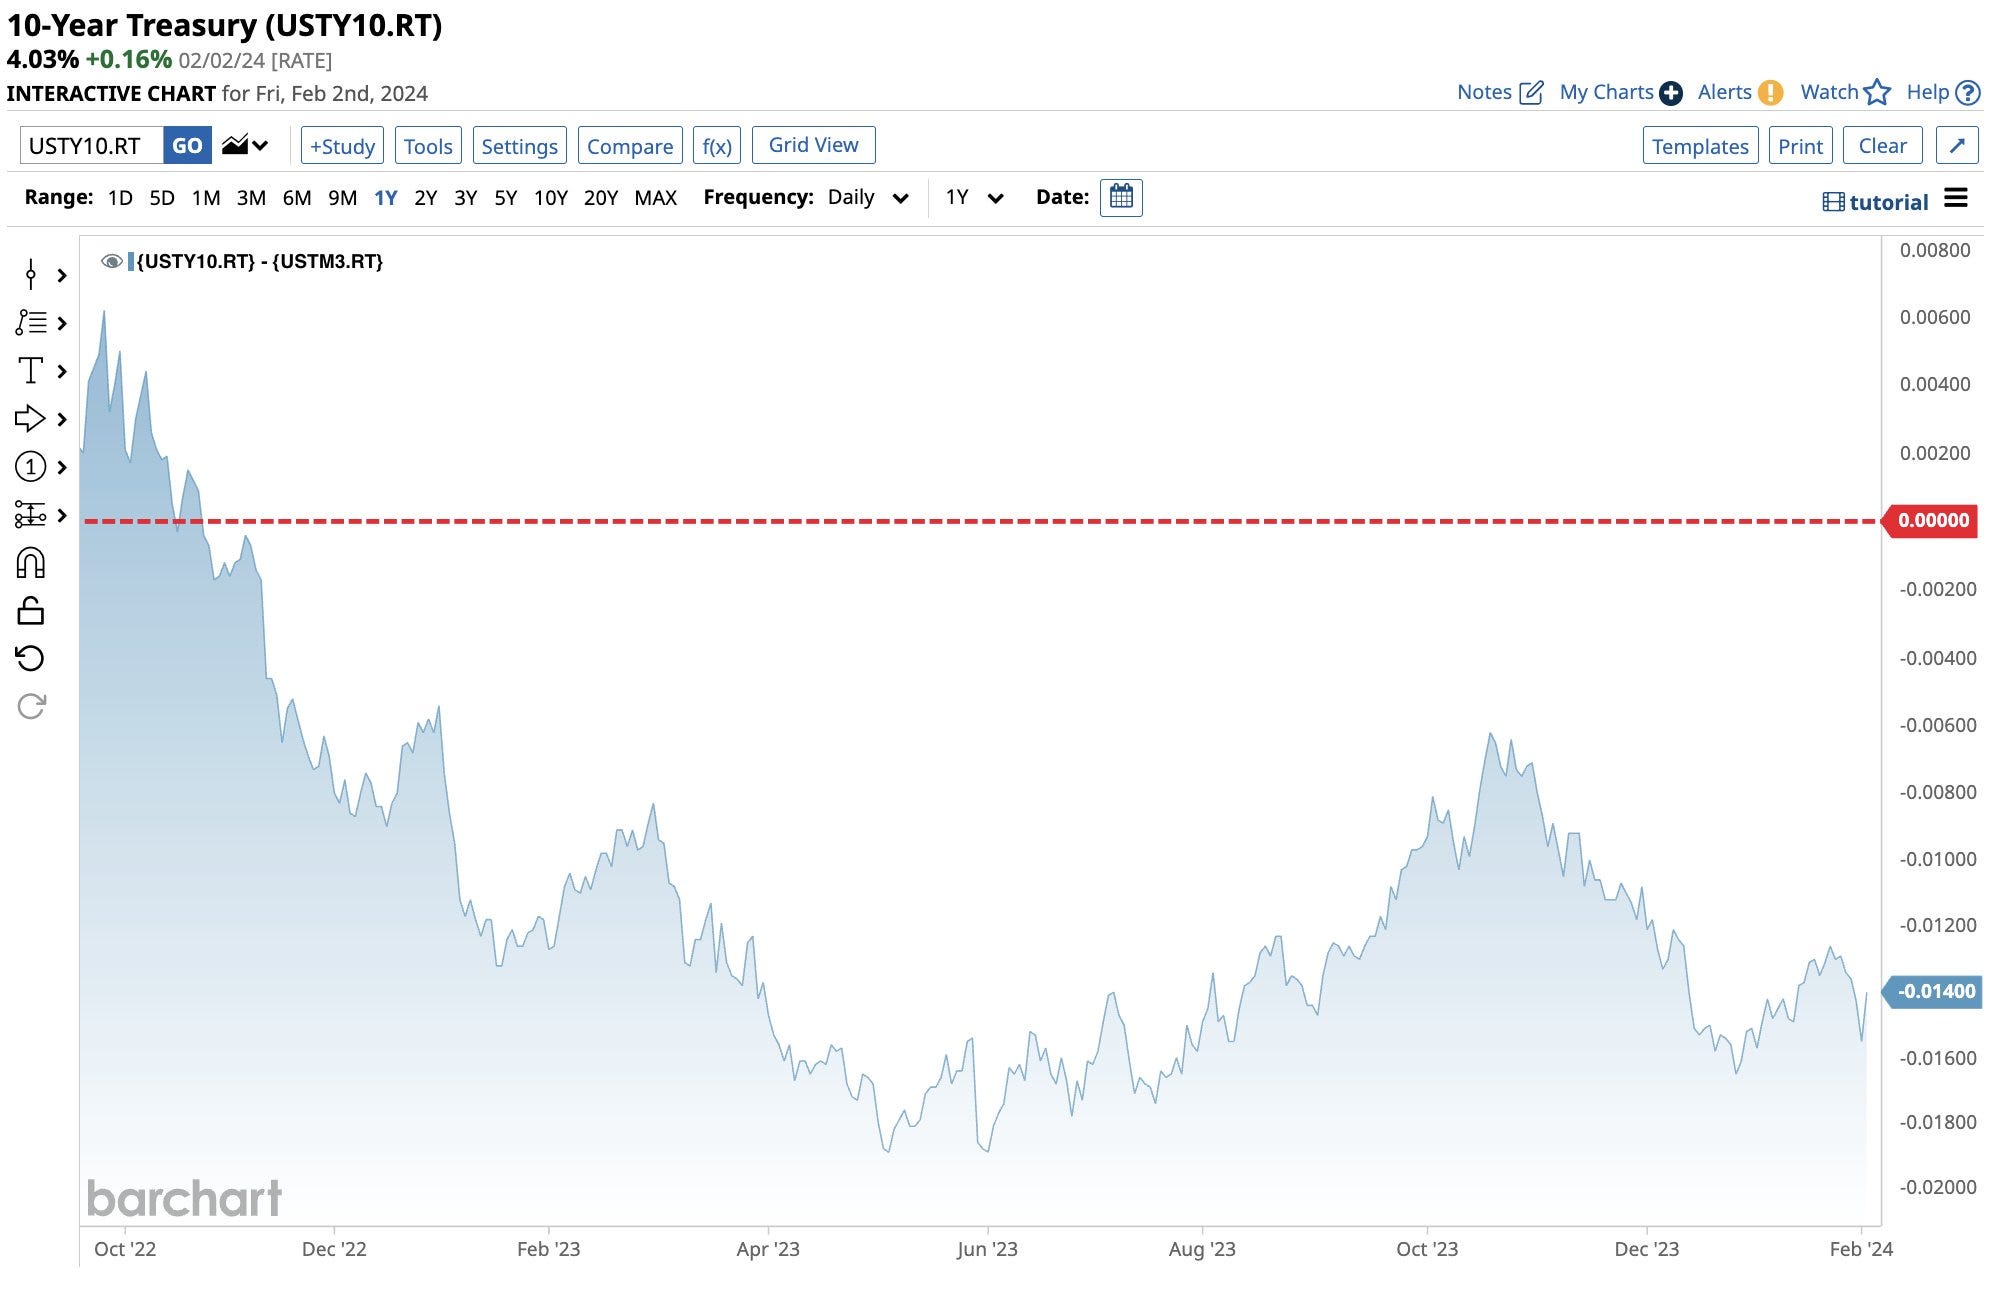
[3] The 10-Year minus the 3-Month Treasury Yield Curve has been inverted for 308 consecutive trading days, the longest stretch of time in history.
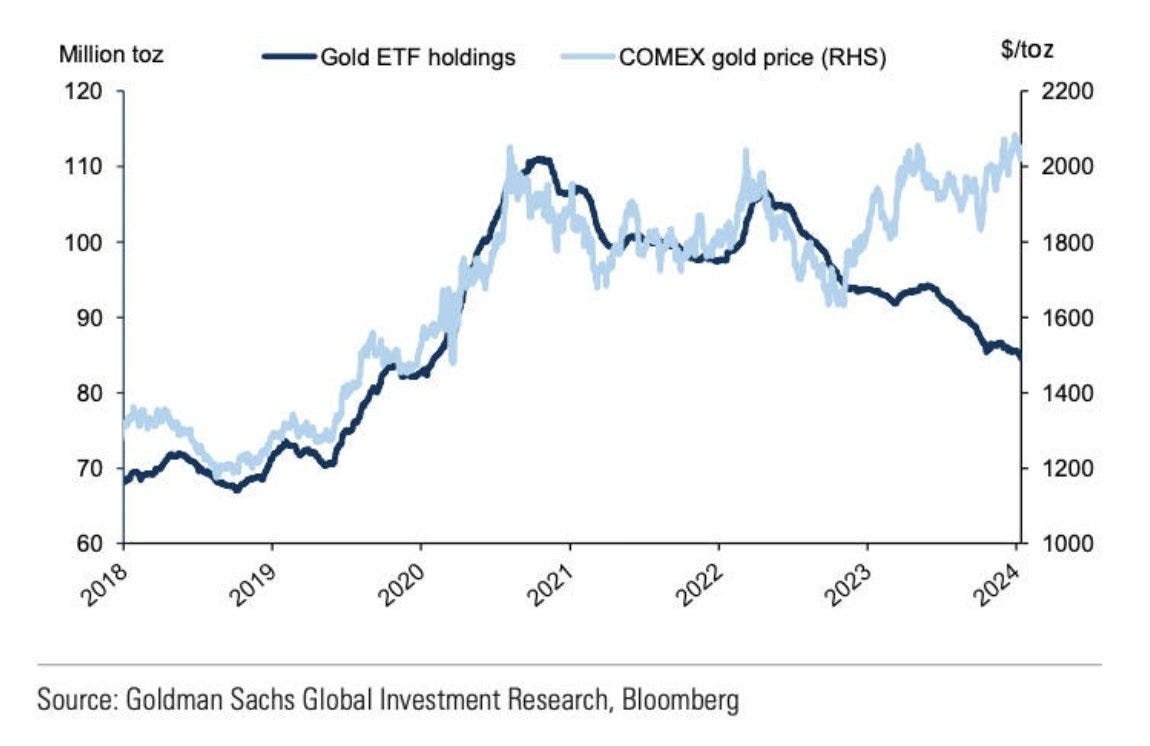
[4] Gold ETFs continue to sell off despite all the noise of strengthening fundamentals!
[5] Two notable features of the Indian interim budget 2024-25 were (i) Nominal GDP growth projection for FY25 at 10.5%, implying a well-controlled inflation environment; and (ii) Fiscal deficit of 5.1% of GDP for FY25BE, implying a strong commitment to fiscal discipline.

[6] Shipping cost up 2x+ since Nov-23 boosting inflation. Fed knows this and pushed the rate cut from March 2023 ahead.

[7] There was a time in pre-2015 when China selling would cause US investors selling too. Now reverse is happening, even though magnitude is small.

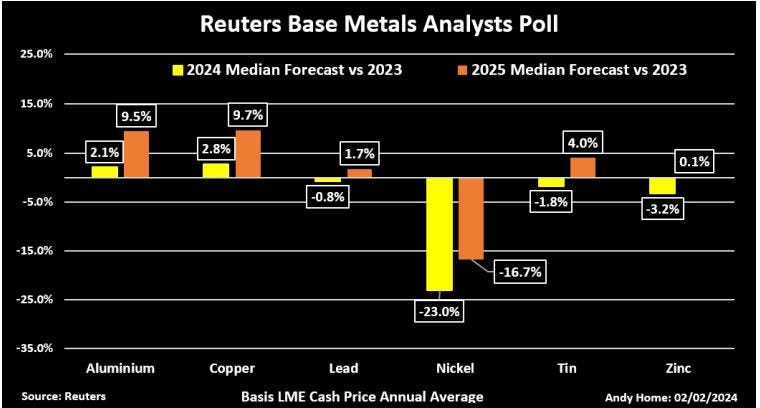
[8] Slowdown in global growth led by China has led to cut in estimates for commodity pirces in Reuters Base metals analyst poll for 2024 and 2025.
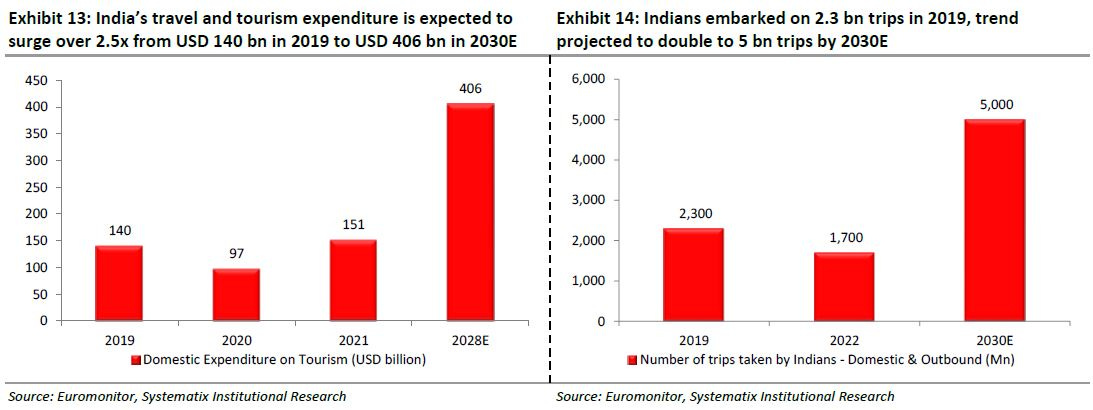
[9] Travel will grow big in India as supply of hotels in 2026-30E looms large!
[10] When there is a consensus in economic view, can markets surprise?

Disclaimer:
This newsletter is for information and educational purposes only. In this material, Amit Kumar Gupta (SEBI registered Research Analyst, INH100009327) has used information that is publicly available and is believed to be from reliable sources. While utmost care has been exercised, the author does not warrant the completeness or accuracy of the information and disclaims all liabilities, losses and damages arising out of the use of this information. Readers, before acting on any information herein should make their own investigation & seek appropriate professional advice. Any sector(s)/ stock(s)/ issuer(s) mentioned do not constitute any recommendation and the RA may or may not have any future or existing position in these. All opinions/ figures/ charts/ graphs are as on date of publishing (or as at mentioned date) and are subject to change without notice. Any logos used may be trademarks™ or registered® trademarks of their respective holders, our usage does not imply any affiliation with or endorsement by them. Past performance on charts may or may not be sustained in the future and should not be used as a basis for comparison to infer any investment ideas