
AKG weekly charts - Issue #134
AKG weekly charts - Issue #134
This newsletter is a weekly selection of 10 charts hand-picked across the internet which pertains to our investment strategy and bring an updated insight and perspective.


Summary of financial markets in last week here.
Media interviews with News9 in last week here and here
Feb’24 review of our equity research strategies - Emerging leaders, Wealth compounders & Special Situation
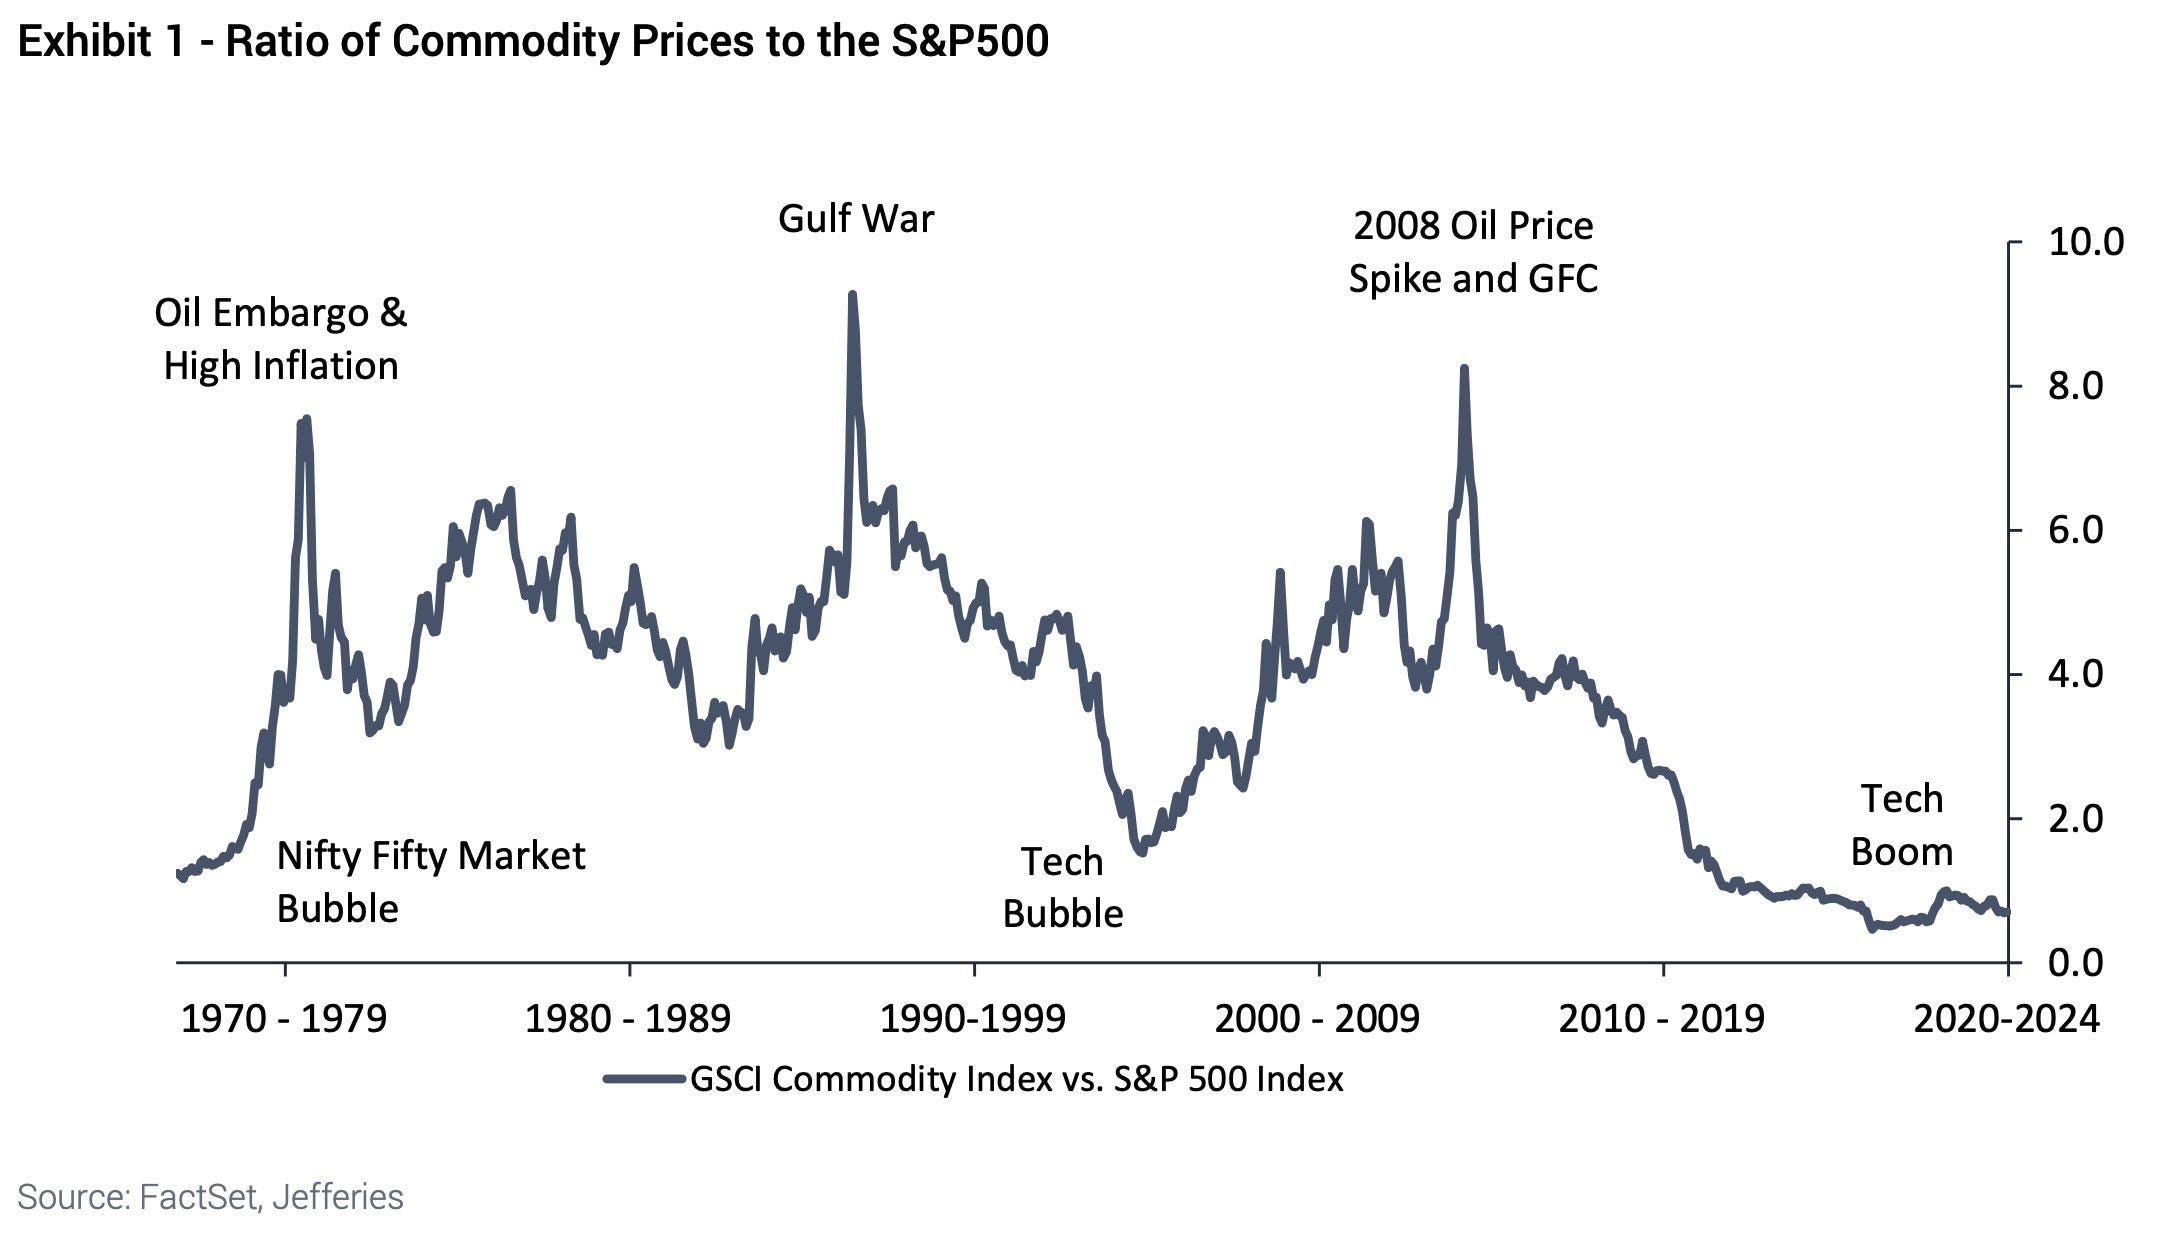
[1] Ratio of Commodity prices to the S&P500 is near All-Time lows. Time for a turnaround in 2024?
[2] All cryptocurrencies are hitting new highs. Memecoin weekly volume hits highest level since 2021.

[3] Apple is underperforming the Nasdaq 100 this year by the largest margin in more than a decade. Fab 7 is becoming Fab 5 with Tesla also undergoing similar underperformance.

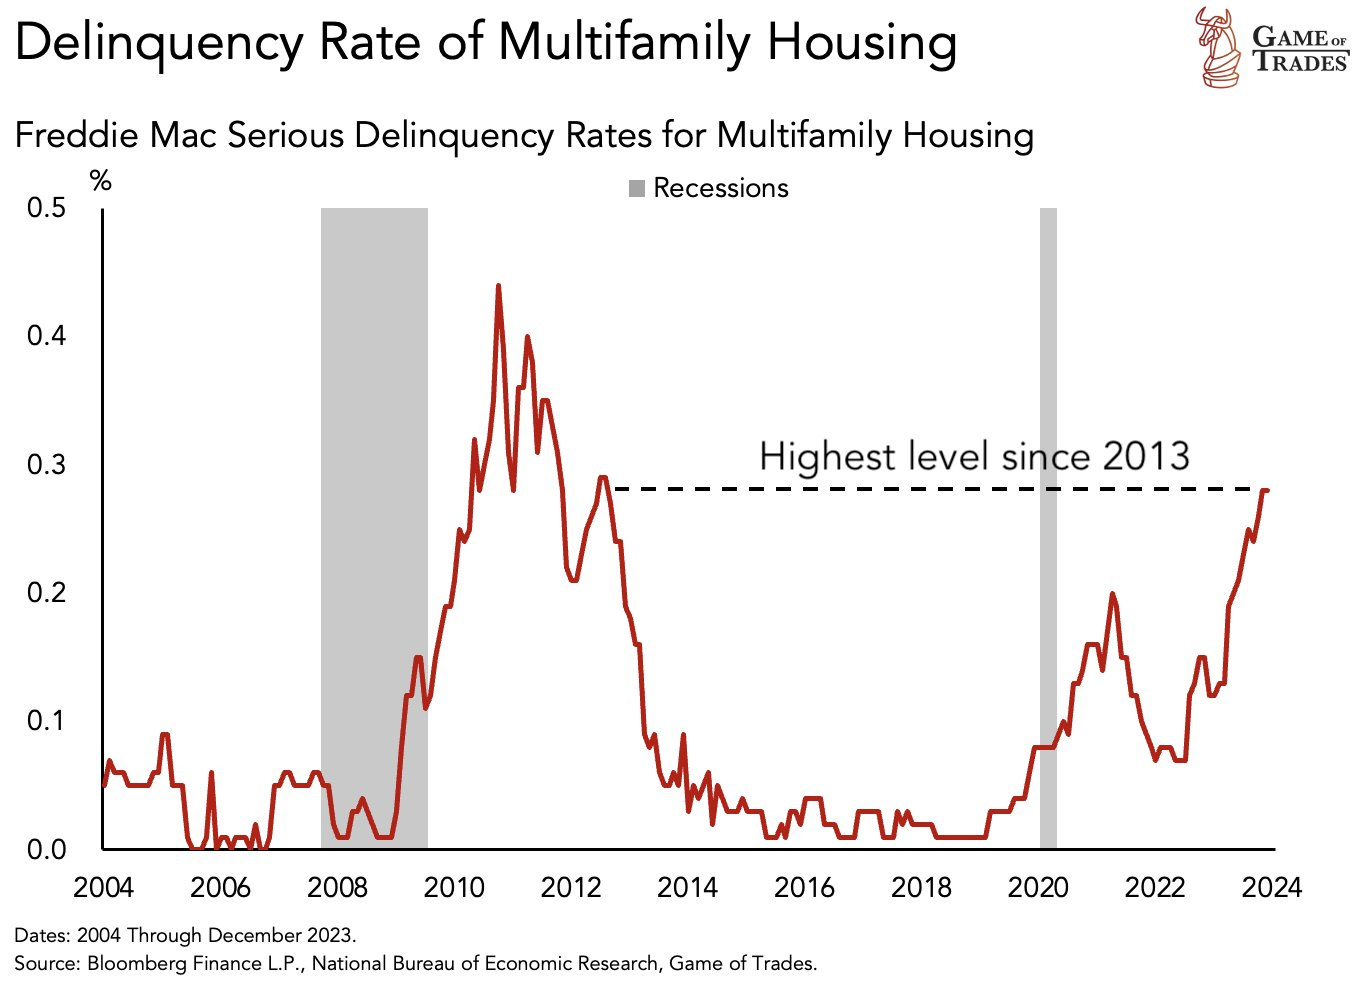
[4] Multi-family Housing defaults are now at the highest levels in a decade. Note : This is not single housing units in US. But nevertheless, interesting data to track.
[5] S&P 500 Options Skew drops to lowest level since the runup to the Global Financial Crisis. This means traders are more concerned with capturing upside gains than they are with protection.

[6] The mean reversion from peaks noticed in CY22 seem to be coming through, but in large parts, the massive deflation witnessed across commodities can be attributed to the rampant supply from China. Aggression originating from the East is clearly visible in their increased share in global trade, increased volume of exports, along with a steep reduction in the $ value of their exports, suggesting higher volumes at lower prices
h/t Old Bridge Capital memo

[7] The semiconductor trade has now declined for two consecutive weeks. What part of value chain one should bet in this correction?
Source : SOIC

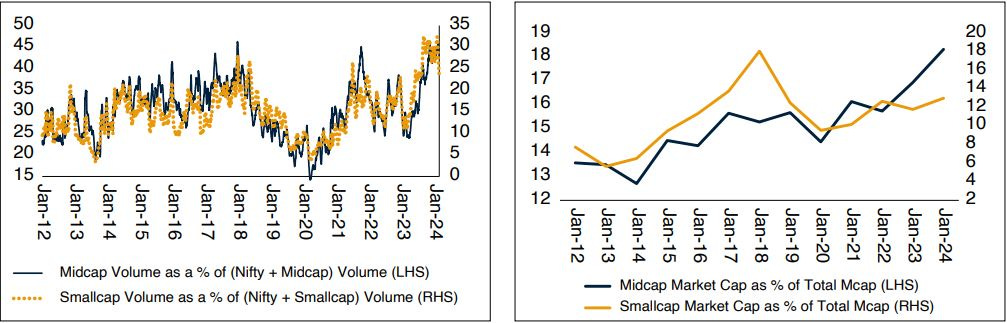
[8] While SMID volumes are elevated relative to historic peak, yet again, it has to be seen in proper perspective of share of SMID in overall market cap. It is natural that increasing share in overall Market Capitalisation will reflect in the rising share in market volumes. Especially on back of trend of strong domestic investor participation in equity markets as is reflected in FPI ownership of NSE500 coming off to ~20% (September 2023) from high of ~23% (June 2015).
Source : MOSL
[9] As a part of Breadth Analysis, here are Key TOP and BOTTOM Dates of Nifty in past 10 years and number of Nifty 50 components which were above critical averages on that particular days
Source : PL brokerage note

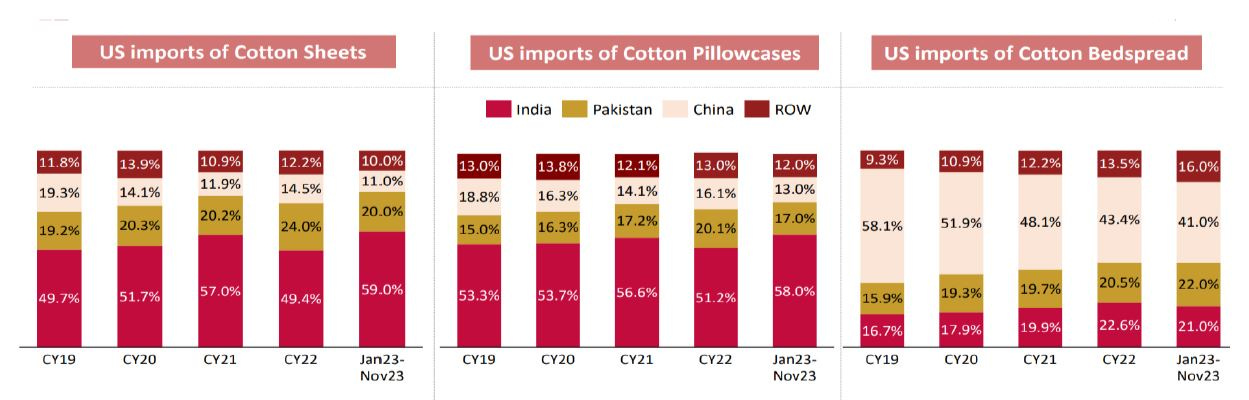
[10] Indian home textile players are seeing a continuous increase in market share driven by the China+1 theme. China is losing market share due to the ban imposed by the US on cotton from its Xinjiang region on human rights issues, higher manufacturing cost, and focus on its domestic market. Logical to expect this trend in market share gains to continue ahead!
Source : ICIL Presentation
Connect on various social media platforms here
Subscribe (free) to #AKGweekendreadings here [released every Friday evening]
Disclaimer:
This newsletter is for information and educational purposes only. In this material, Amit Kumar Gupta (SEBI registered Research Analyst, INH100009327) has used information that is publicly available and is believed to be from reliable sources. While utmost care has been exercised, the author does not warrant the completeness or accuracy of the information and disclaims all liabilities, losses and damages arising out of the use of this information. Readers, before acting on any information herein should make their own investigation & seek appropriate professional advice. Any sector(s)/ stock(s)/ issuer(s) mentioned do not constitute any recommendation and the RA may or may not have any future or existing position in these. All opinions/ figures/ charts/ graphs are as on date of publishing (or as at mentioned date) and are subject to change without notice. Any logos used may be trademarks™ or registered® trademarks of their respective holders, our usage does not imply any affiliation with or endorsement by them. Past performance on charts may or may not be sustained in the future and should not be used as a basis for comparison to infer any investment ideas