AKG weekly charts - Issue #147
This newsletter is a weekly selection of 10 charts hand-picked across the internet and research reports which pertains to our investment strategy and bring an updated insight and perspective.

Summary of financial markets in last week here
Connect on various social media platforms here
FC Investment outlook presentation for 2025 and 2024 review here [Visit www.fintrekkcapital.com for subscription details]
Dec’24 review of our equity research strategy- Special Situation & Wealth Compounders. [Visit www.fintrekkcapital.com for subscription details]
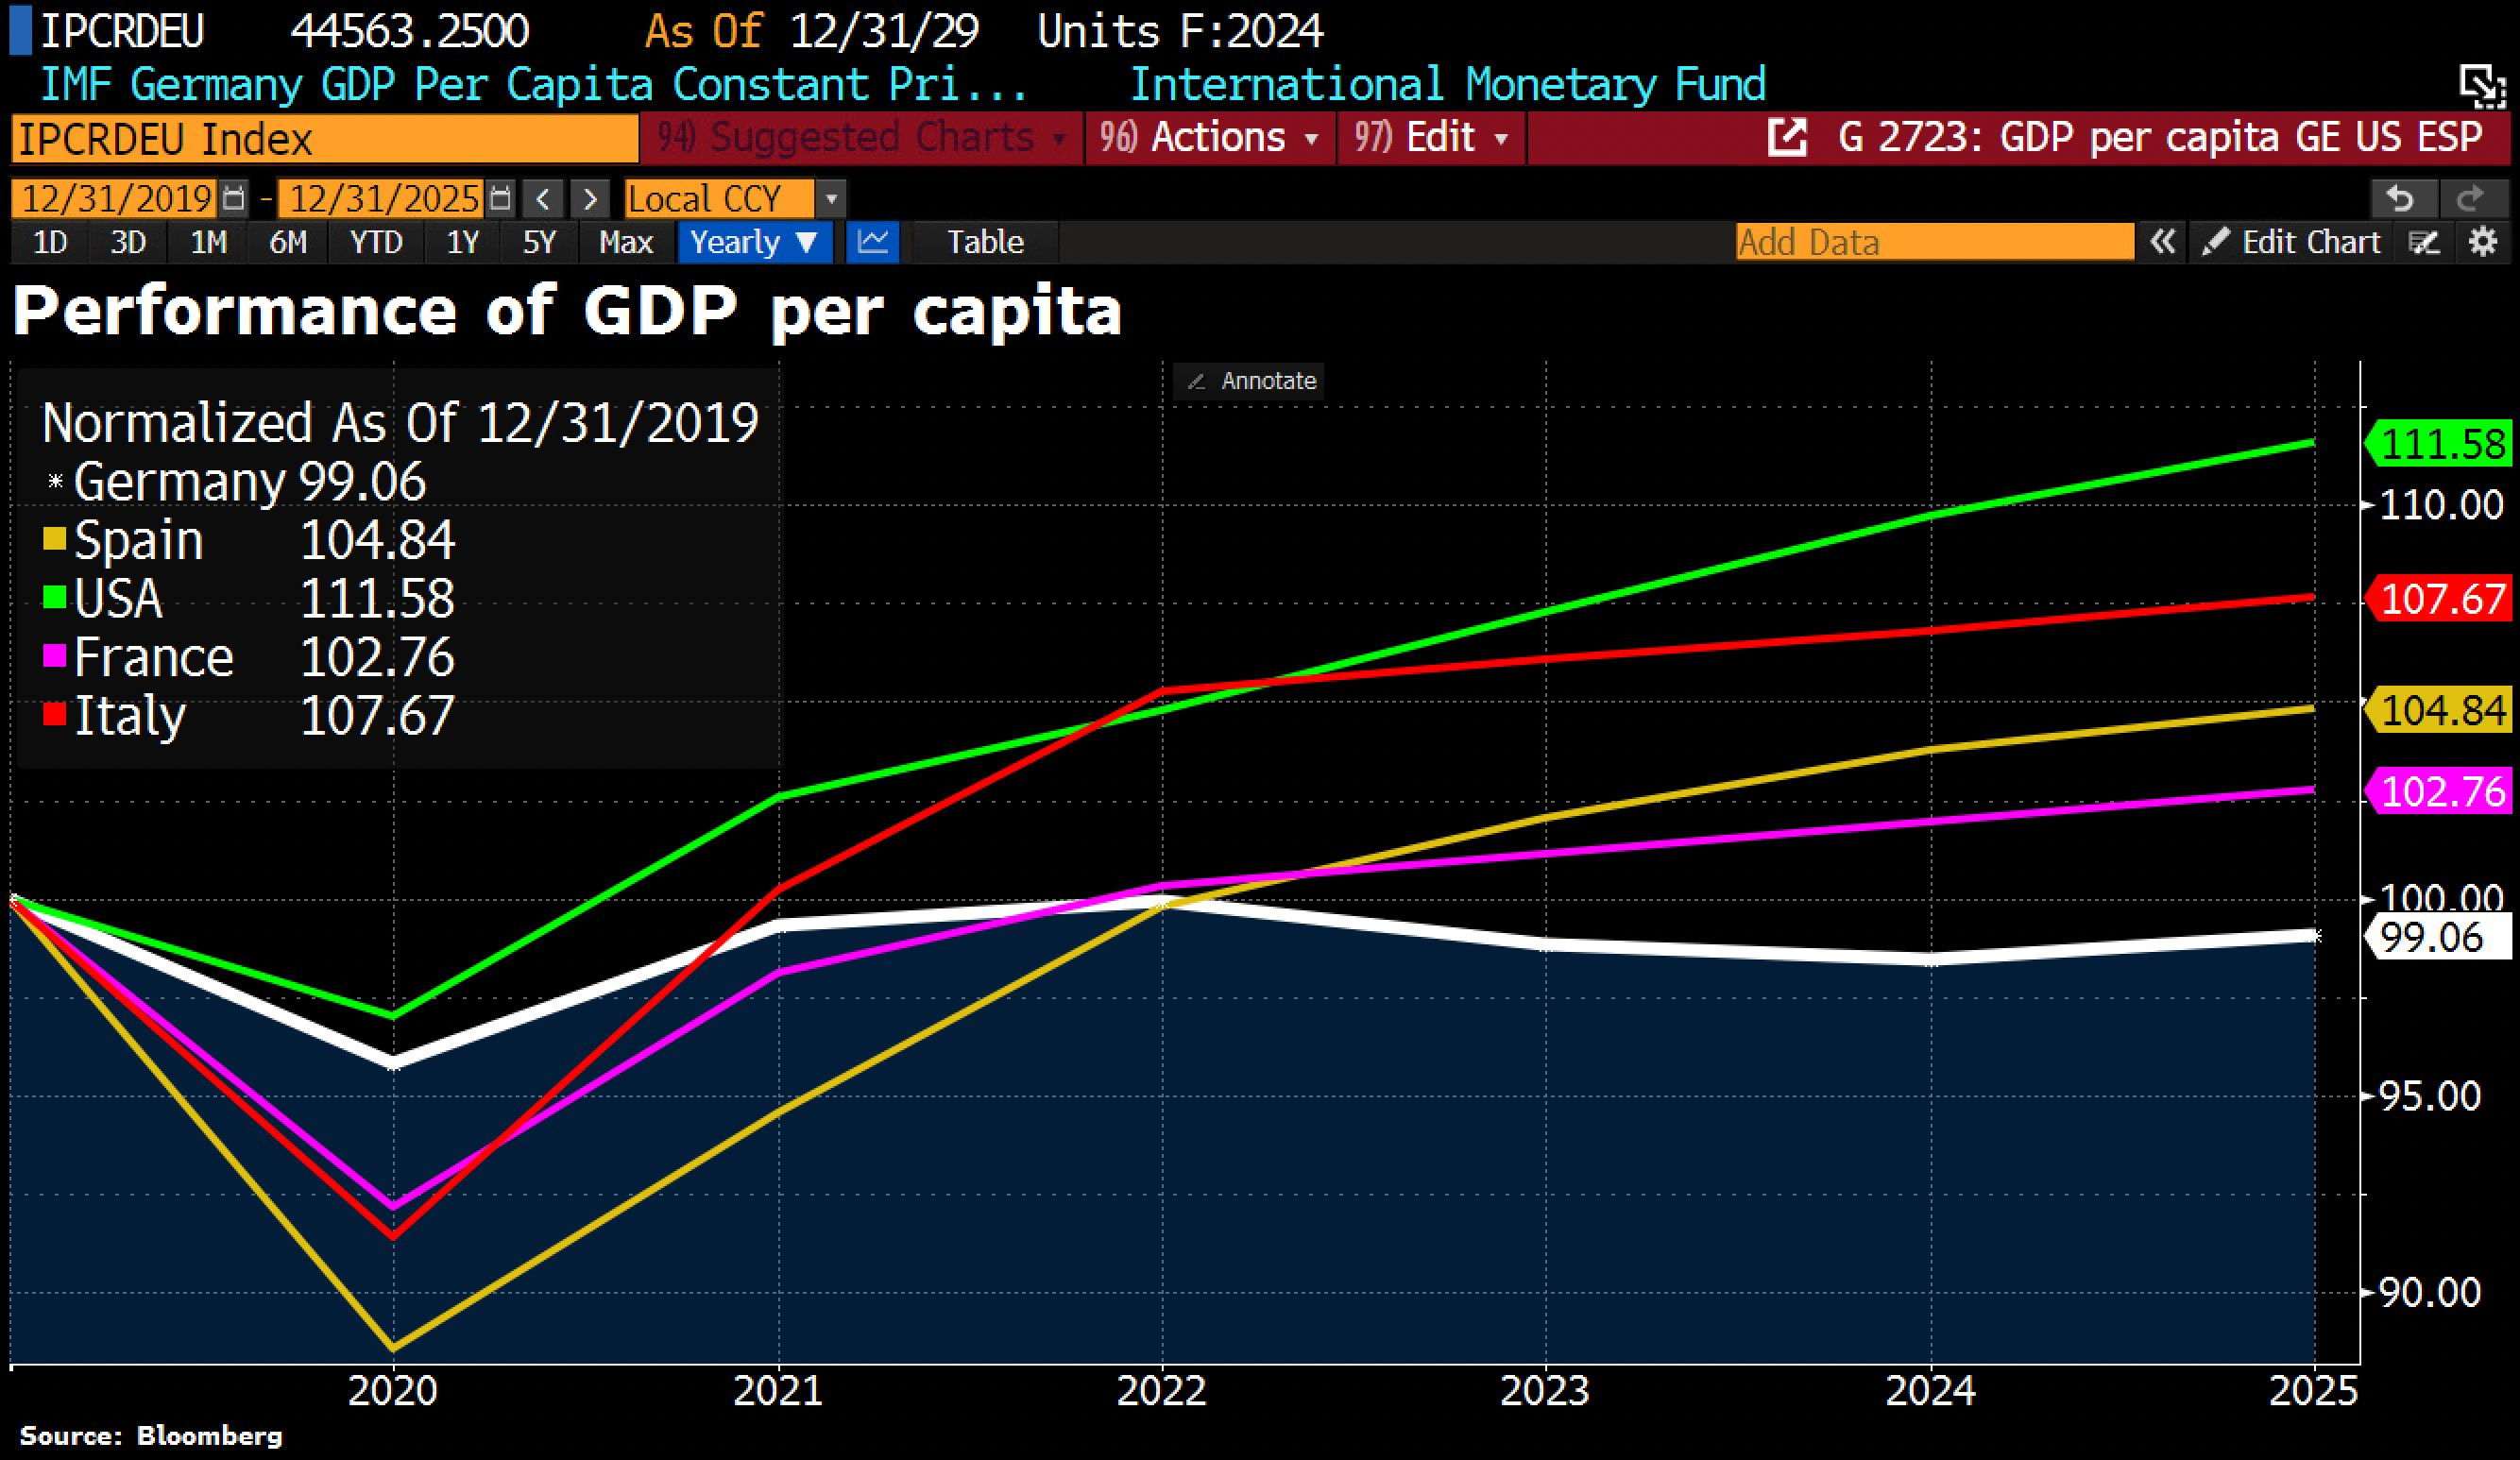
[1] Germany is the only major industrialized country where GDP per capita remains below its 2019 level in 2025. In contrast, Americans are now 11% wealthier on avg, Italians 8%, Spaniards 5%, and the French 3%.
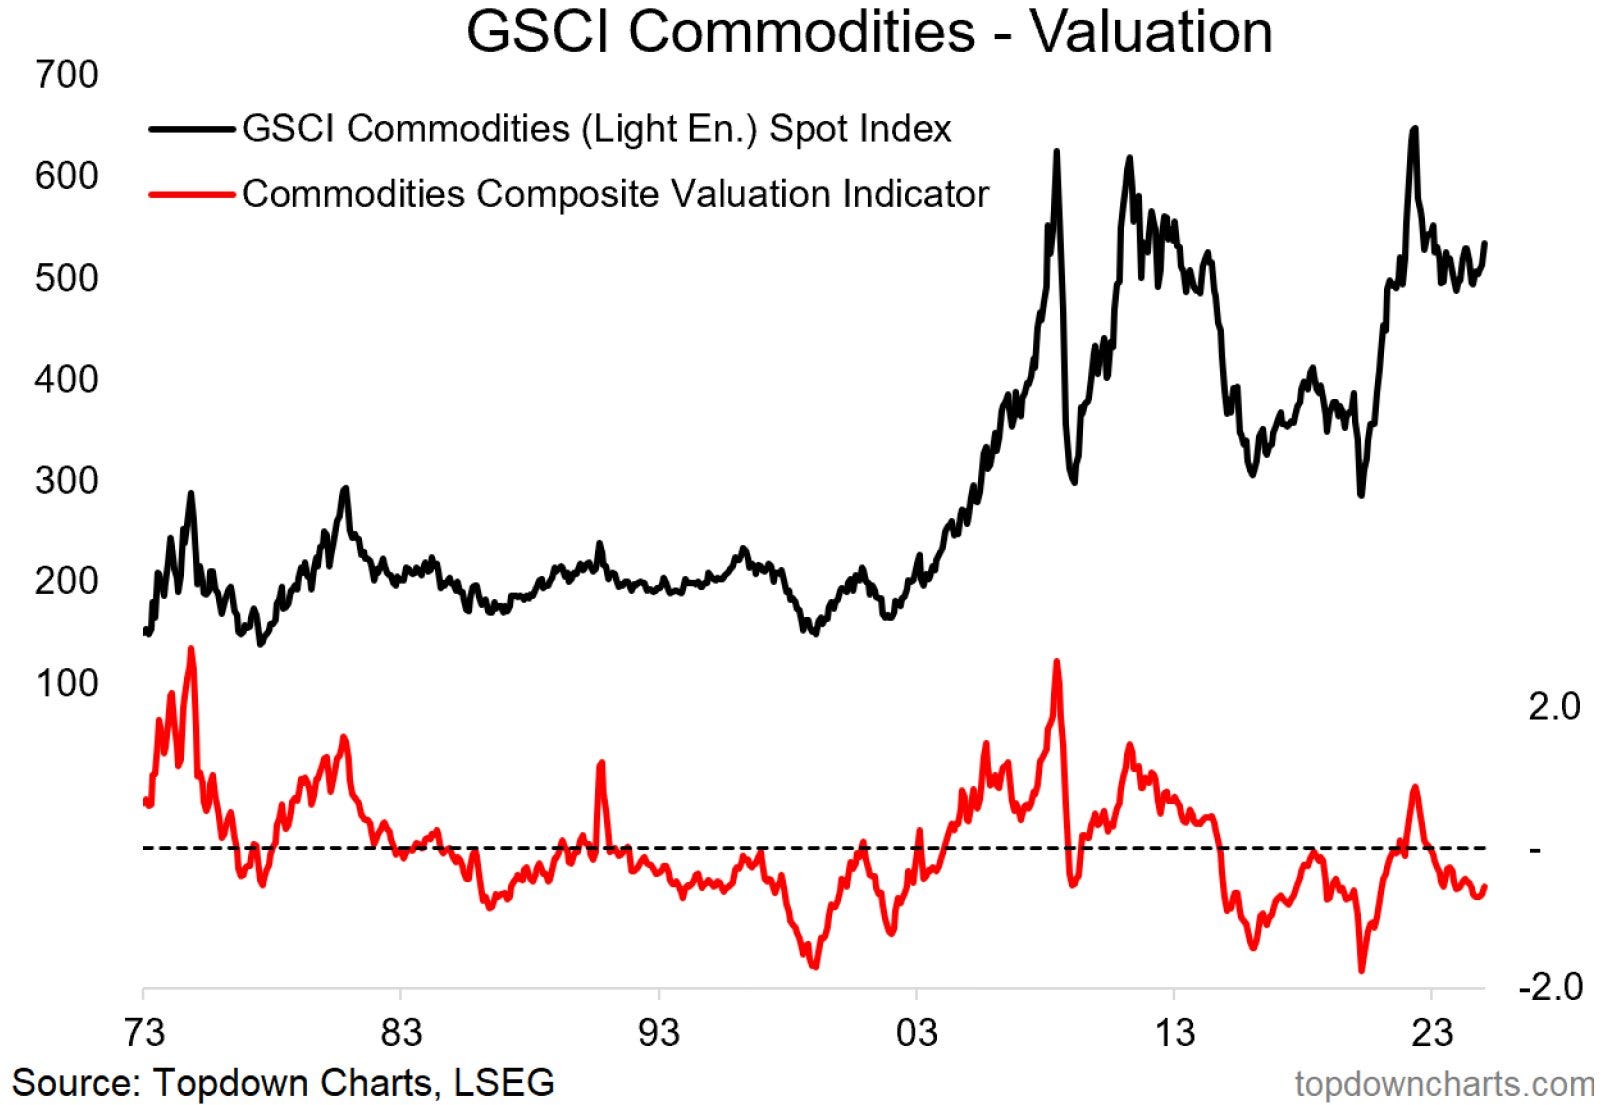
[2] Commodities are cheap in valuations. That’s a major boost to invest. Will it be volatile in a trump-led tariff war enviroment? 100%
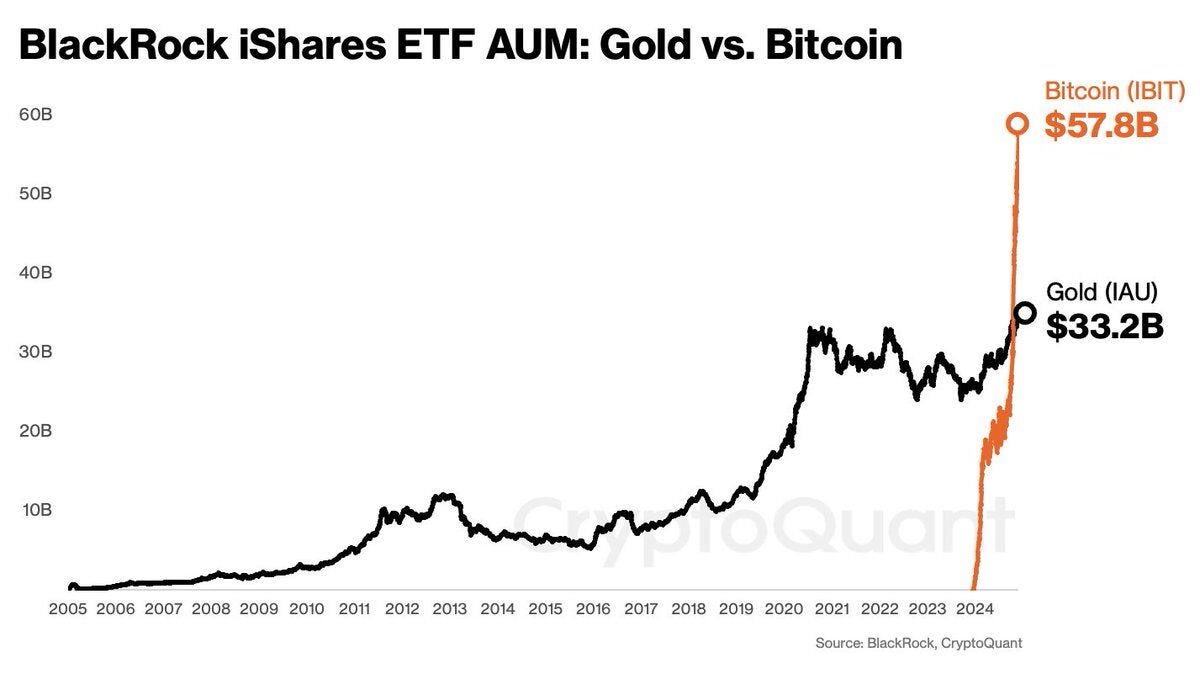
[3] Bitcoin m-cap has shot past Gold ETF AUM now. Given the propensity of Crypto asset class to fall 50%, expect a mean reversion in 2025.
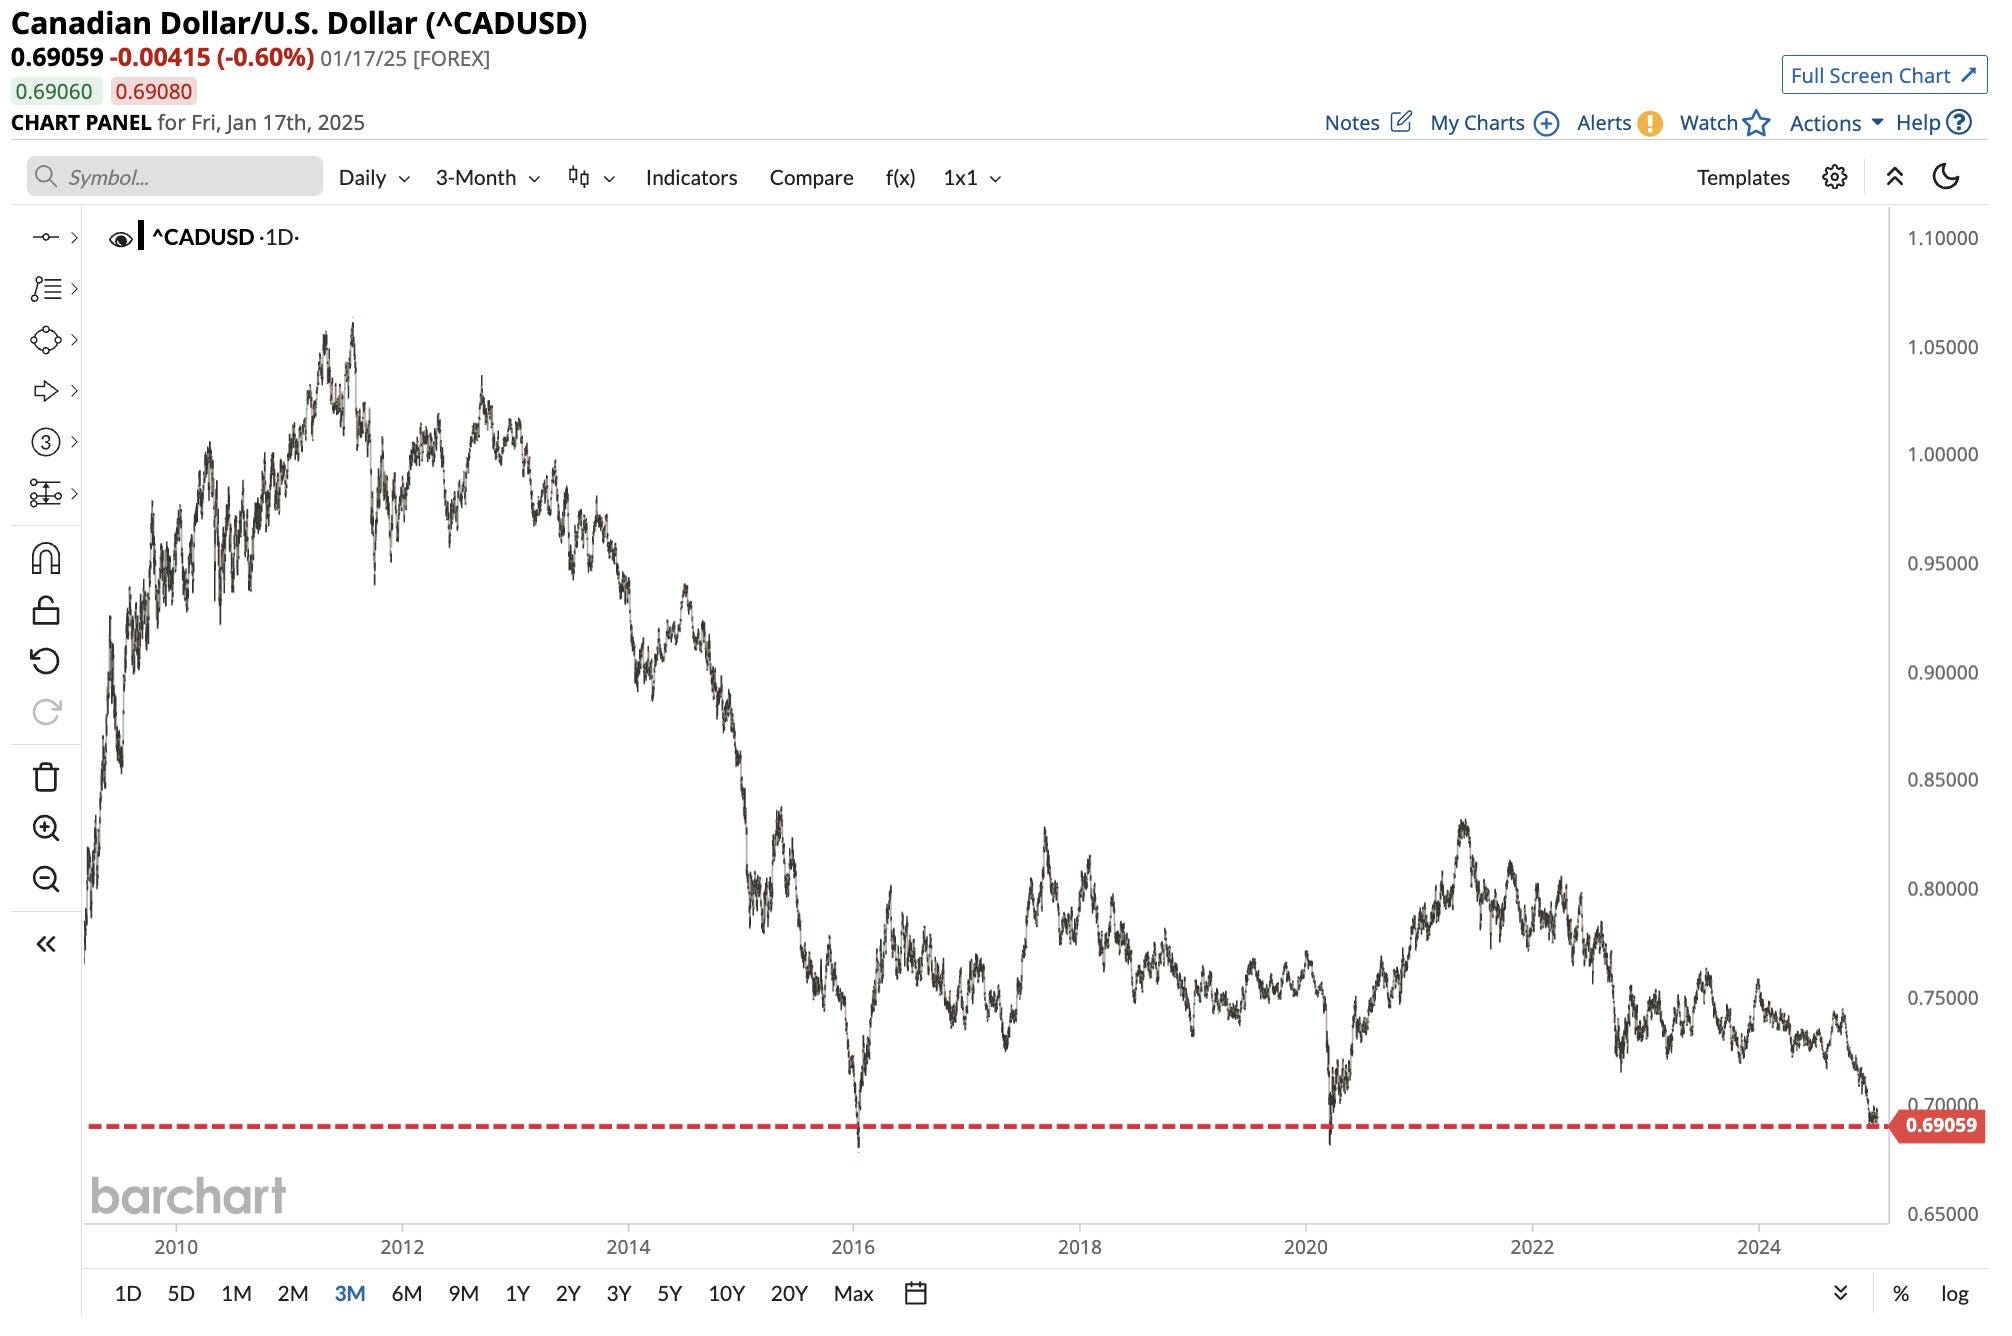
[4] Canadian Dollar plunges to its weakest level against the U.S. Dollar since the onset of Covid and is on the verge of falling to its lowest level since AT LEAST the Global Financial Crisis. 51st state of US not doing so well :)
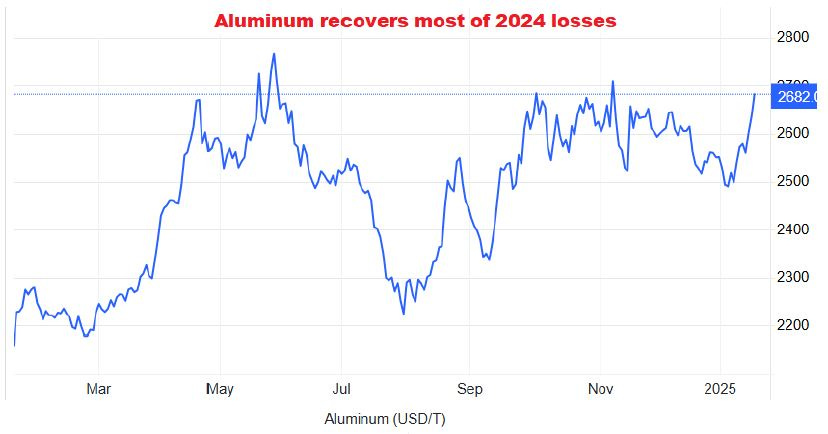
[5] Aluminum has recovered most of 2024 losses and now on the verge of a fresh breakout. A rally to Russia-Ukraine crisis high in 2022 is potential opportunity. Usually direct stocks proxy plays are the best (no reco)
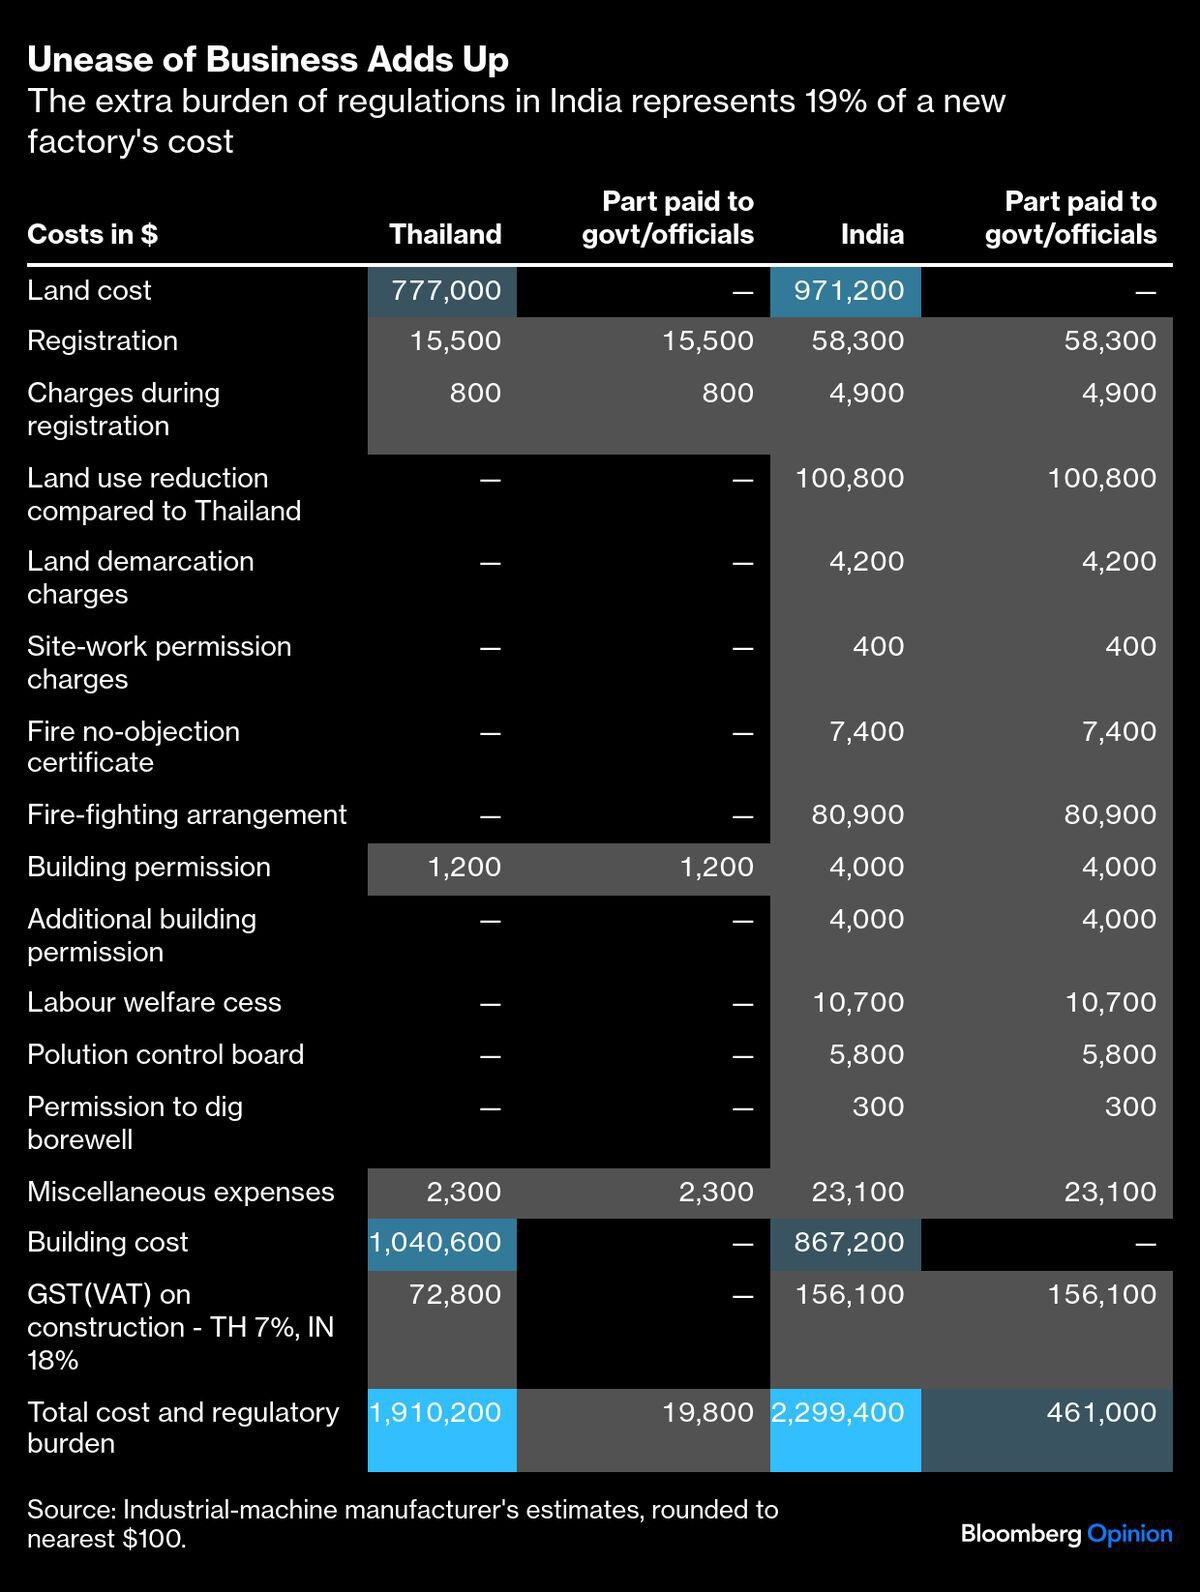
[6] Regulation Tax: Why it’s so expensive and time consuming to set up a factory in India?
India vs Thailand. Fees to Govt in India is 20x of Thailand.
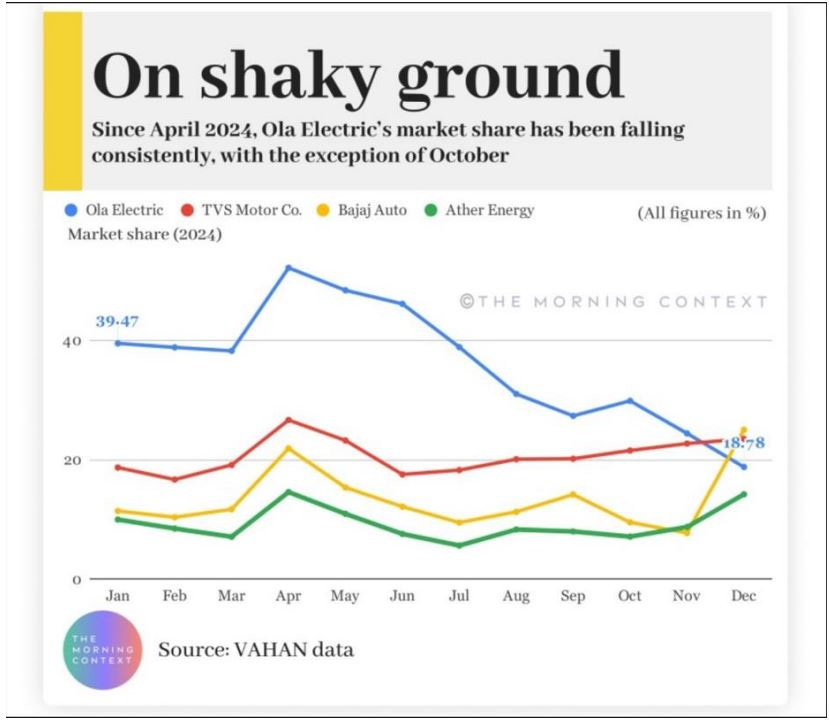
[7] Ola has been losing market share after stock market listing consistently. Add the regulatory issues recently from SEBI, lack of subsidy for 2w under FAME and lack of service stations to counter consumer complaints, one of the major players in the EV space can struggle in the coming quarters.
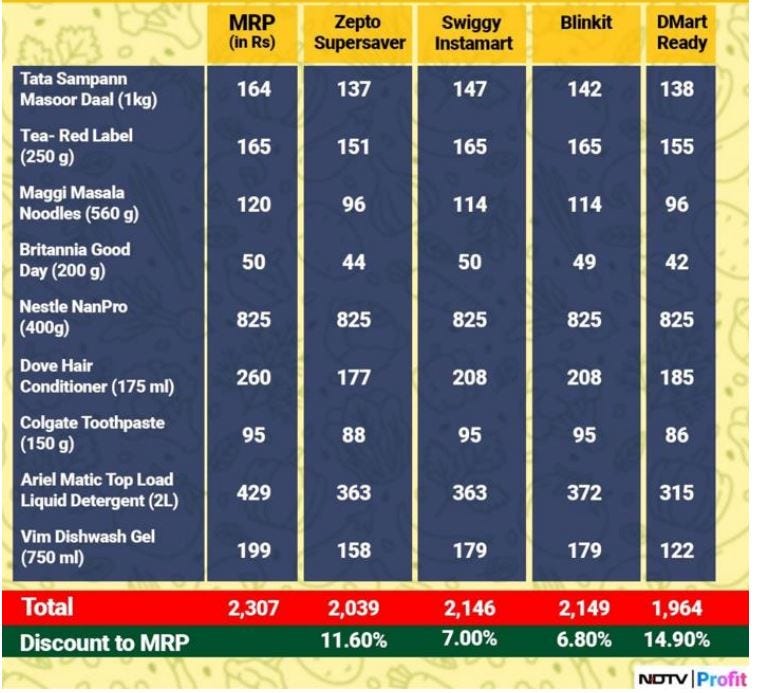
[8] Who offers the best discount in quick commerce?
[9] FII Nifty shorts are at 320k now. Historically, market has made a short term top at 340-360k before short covering triggers a rally in Nifty. Given Trump is taking charge this week and headlines trading will dominate, things will turn volatile for traders. For Investors, Dilli Abhi door hain!

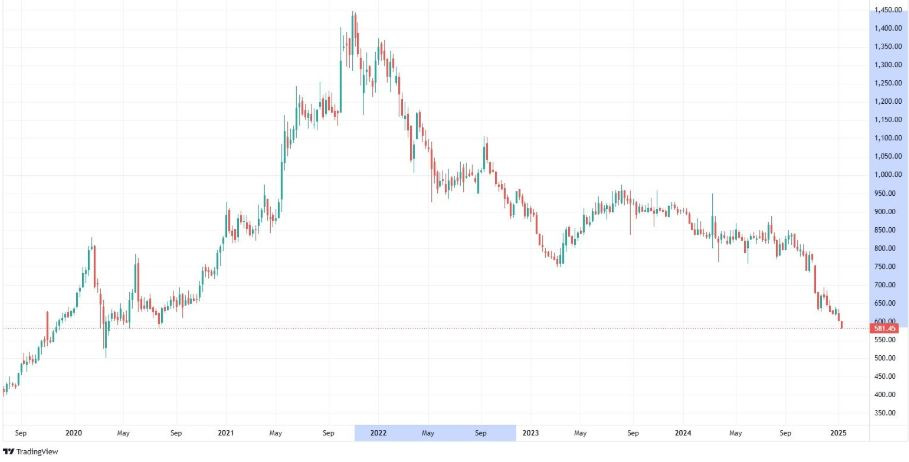
[10] This Stock has fallen 60% from the top. Net profit has gone from 160cr to 280cr to back to 180cr leading to 3% PAT CAGR. Stock is trading at 80 TTM PE. Will you invest in this stock?
Stock name is not important but it tells you the pain story in broader market behind the benchmark indices. Overvalued, overowned, overblown stocks of bull market when correct… don’t automatically become a buy in the bear market!
Disclaimer : This newsletter is for information and educational purposes only. In this material, Amit Kumar Gupta (SEBI registered Research Analyst, INH100009327) has used information that is publicly available and is believed to be from reliable sources. While utmost care has been exercised, the author does not warrant the completeness or accuracy of the information and disclaims all liabilities, losses and damages arising out of the use of this information. Readers, before acting on any information herein should make their own investigation & seek appropriate professional advice. Any sector(s)/ stock(s)/ issuer(s) mentioned do not constitute any recommendation and the RA may or may not have any future or existing position in these. All opinions/ figures/ charts/ graphs are as on date of publishing (or as at mentioned date) and are subject to change without notice. Any logos used may be trademarks™ or registered® trademarks of their respective holders, our usage does not imply any affiliation with or endorsement by them. Past performance on charts may or may not be sustained in the future and should not be used as a basis for comparison to infer any investment ideas
Can you share from where did you get the Nifty chart?
You can use web.strike.money link for plotting data