AKG weekly charts - Issue #155
This newsletter is a weekly selection of 10 charts hand-picked across the internet and research reports which pertains to our investment strategy and bring an updated insight and perspective


My interview on Investing and Special situations with Upsurge [LINK]
My interview on the Investing Journey with Jagran Business [LINK]
Summary of financial markets in last week here.
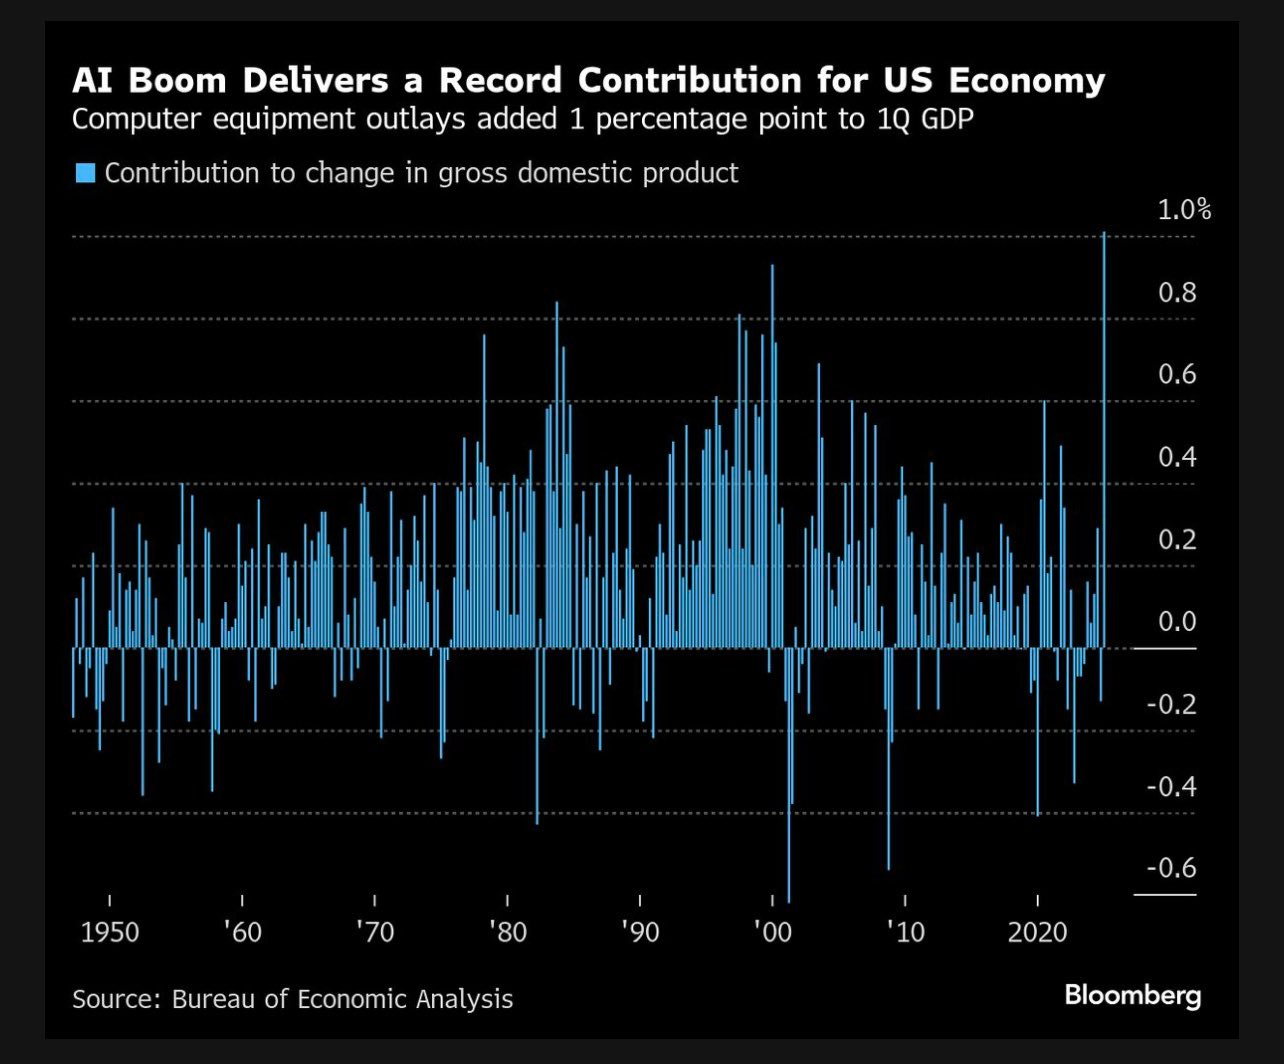
[1] The AI boom is already here. Purchases of computer equipment added a full percentage point to GDP in Q1 2025 in US. That’s higher than the peak of the DotCom Bubble!
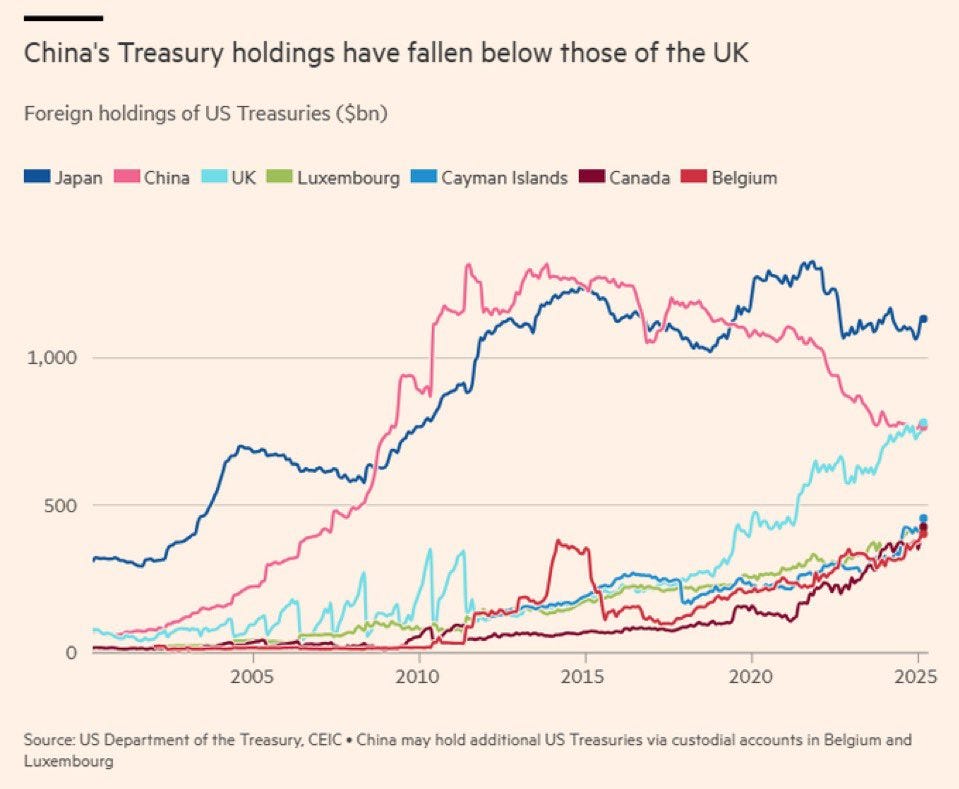
[2] United Kingdom has passed China as the 2nd largest holder of U.S. Treasuries for the first time in 25 years. The geopolitics change everything!
[3] M&A activity globally plunges to lowest level in 20 years, surpassing even the worst point of the Global Financial Crisis. Thankfully, in India market is hot enough for M&A deals and therfore, more oppprtunities to invest in Special Situations!

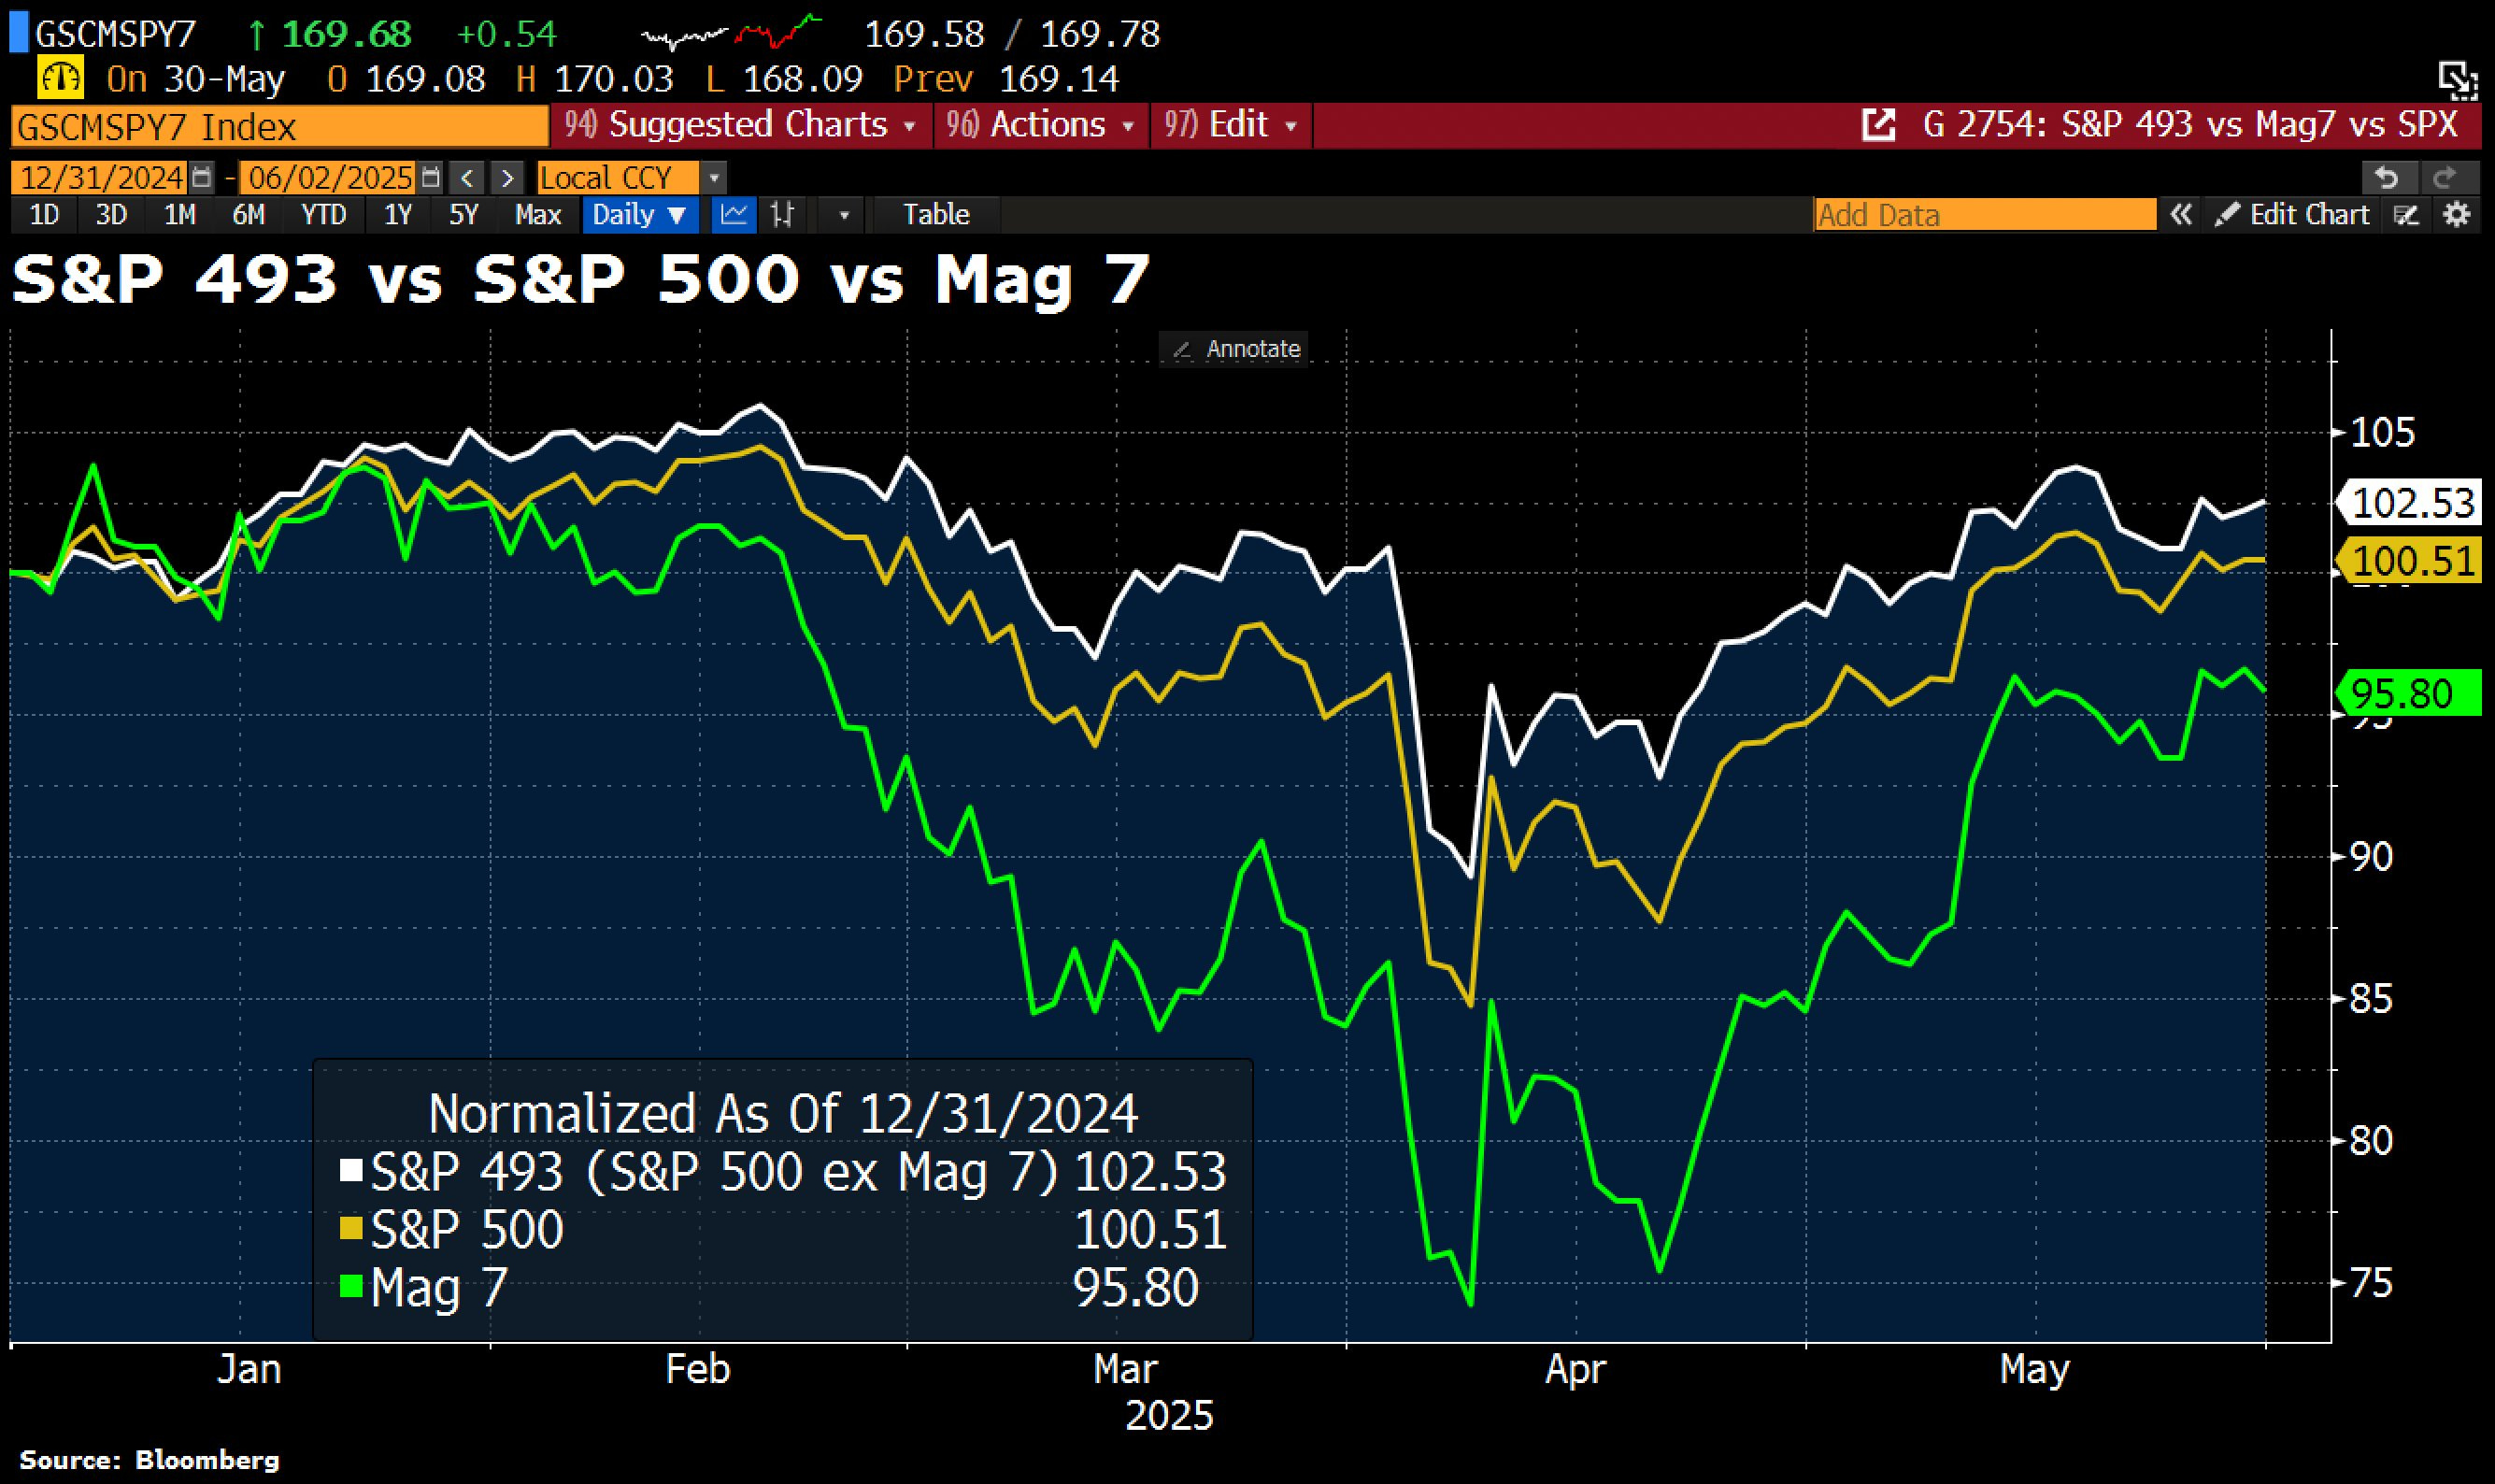
[4] Nvidia’s results included, the Magnificent 7 saw their earnings grow 32% YoY in Q1 — far outpacing the S&P 493, which grew just 8%. Still, the Mag7 stocks are down for the year, while both the S&P 500 and the other 493 companies are slightly up. Breadth is horrible!
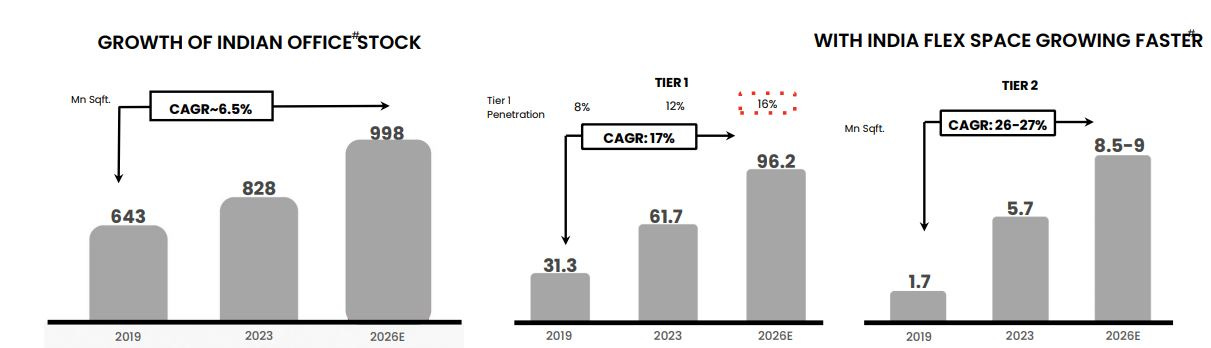
[5] India is among the fastest growing markets in the flex space. Time to get some investing exposure in this space!
Source : Investor presentation
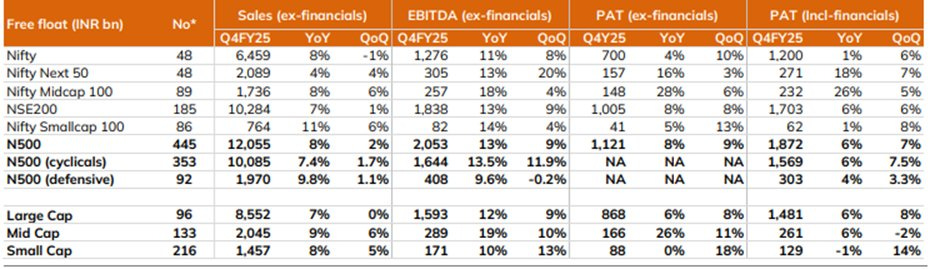
[6] Cylical stocks reported an operating profit growth of about 13.7% (ahead of GVA growth of approx 10%), surpassing the 9.6% growth seen in defensive stocks. PAT growth including financials was about 6%, while non financials grew 9% in India.
Source: ICICI sec research
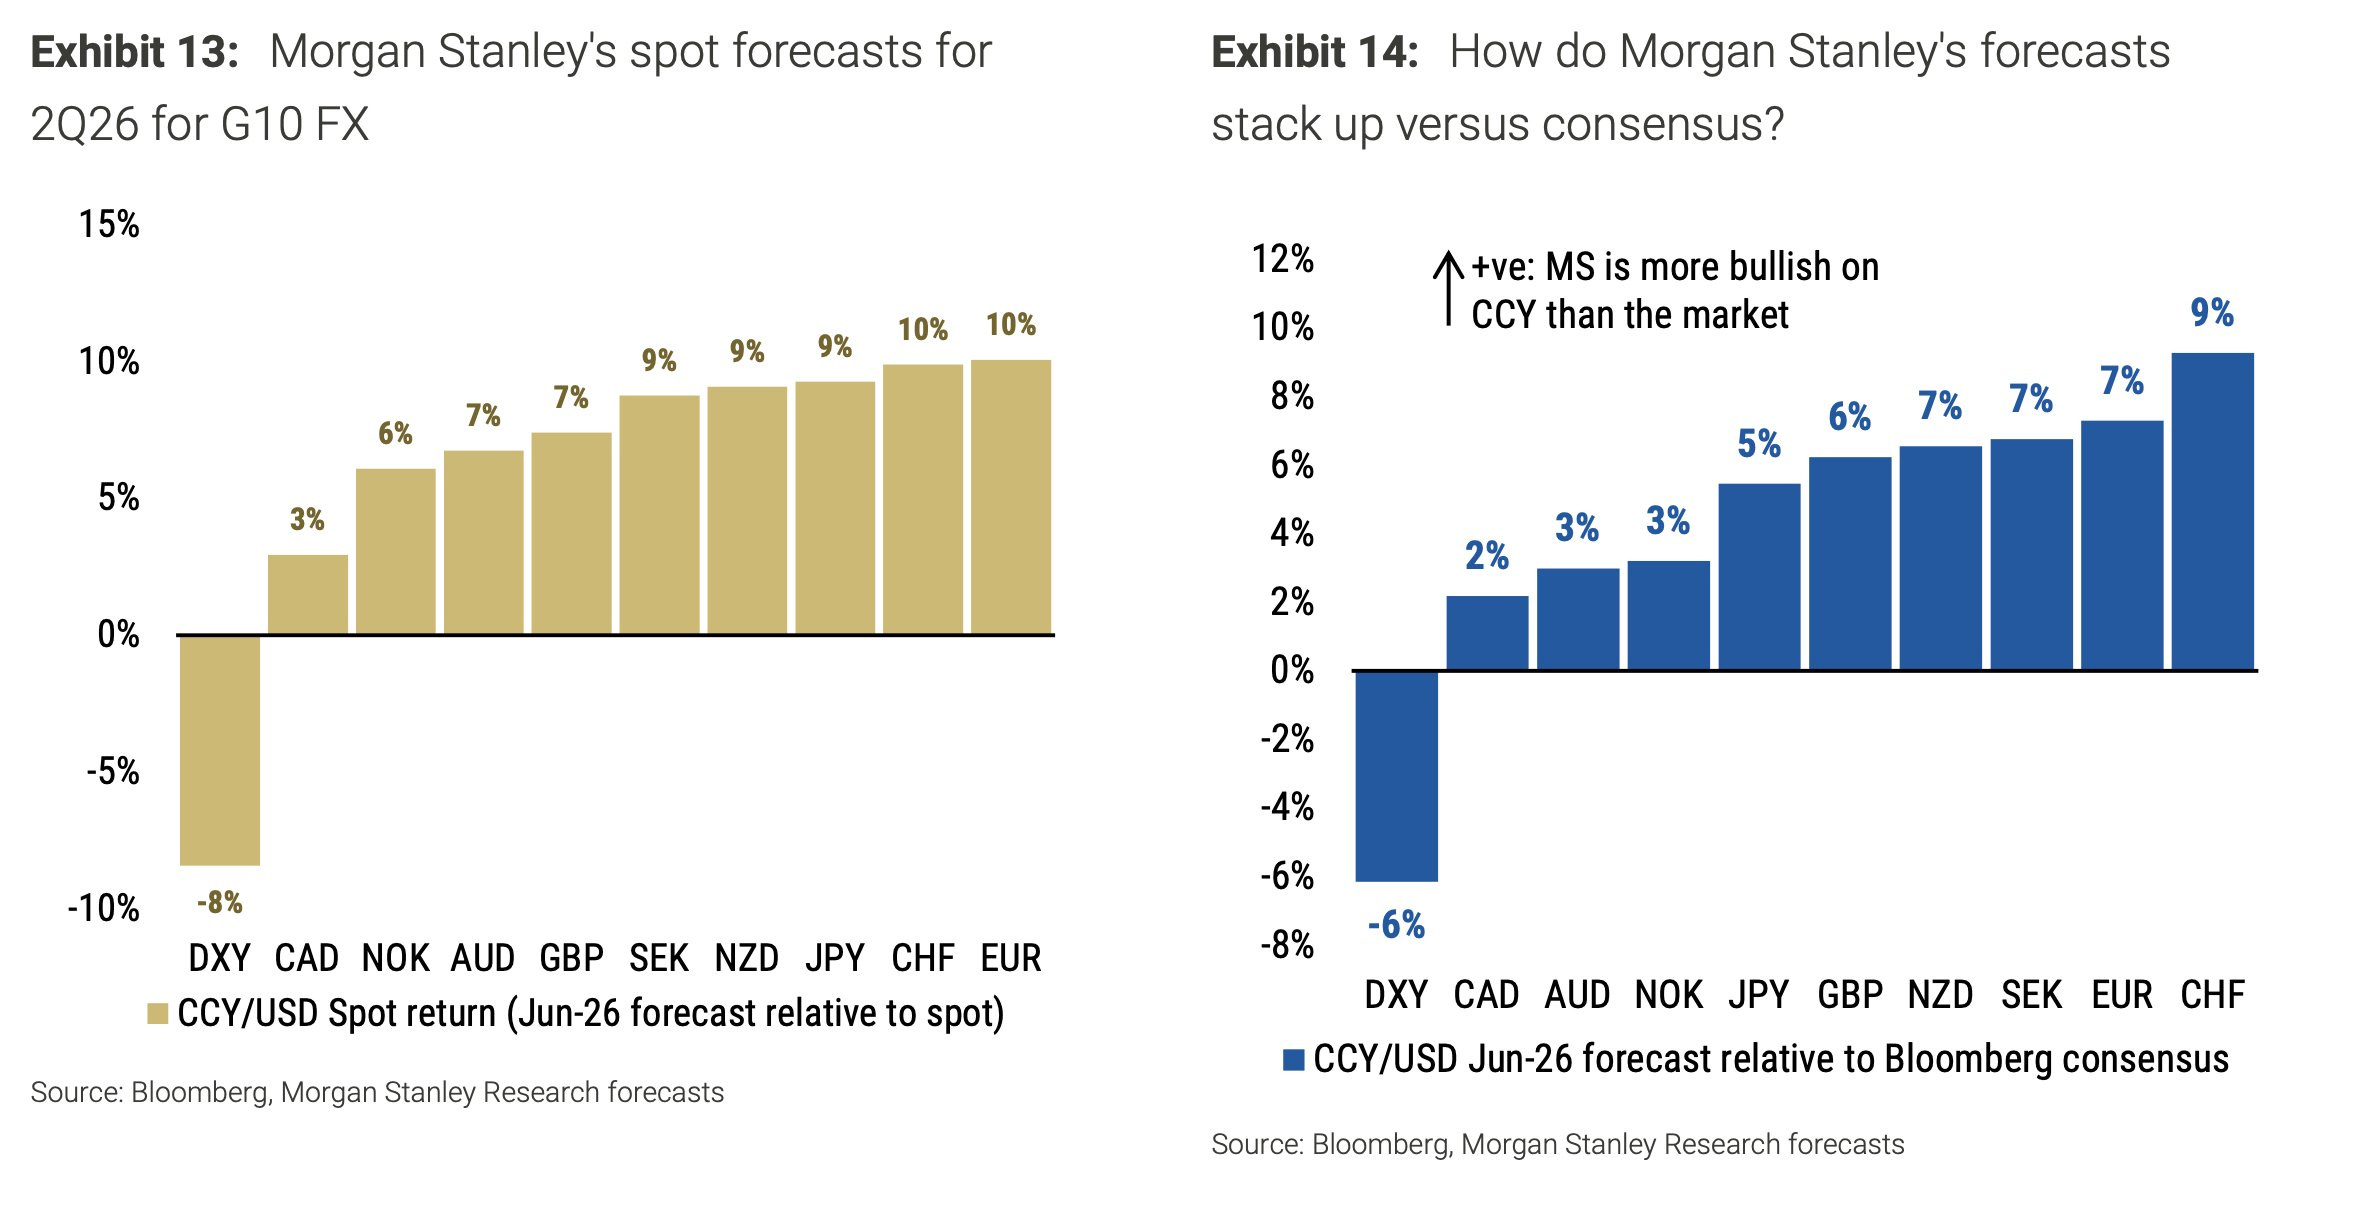
[7] Morgan Stanley sees the Dollar falling ~10% on slowing US growth and amid continued uncertainty over Dollar's safe-haven status. Good for India and EMs!
PS : 95.5-96.5 on DXY is still a strong support. Likely to remain between this support and resistance of 104.50-105.50 for the forseeable future
[8] China unwanted supply creating huge price-demand gaps!

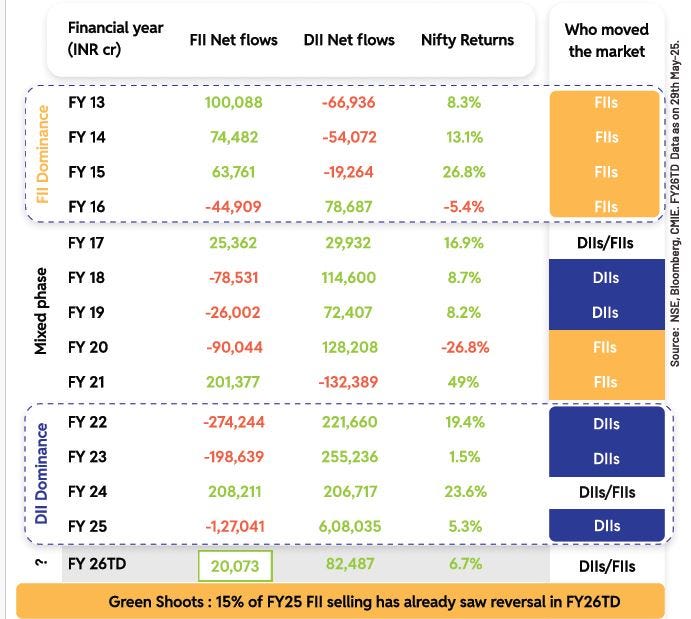
[9] A simplistic way of looking at FII and DII flows in absolute numbers. Neverthless, gives an idea about the net buyers/sellers in last 13 CYs.
For more nuanced version of understanding FII inflows, read this
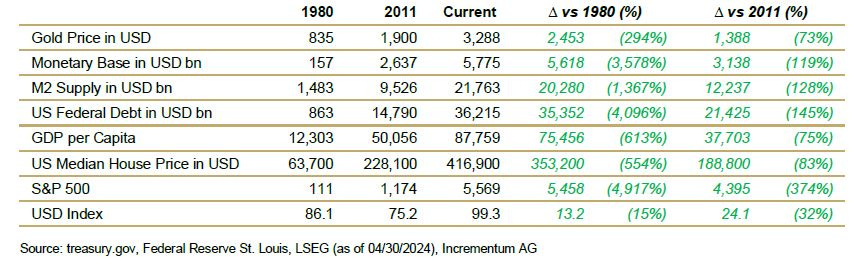
[10] Comparison of various Macro- and Market Key Figures at Gold ATH in 1980, 2011 and 2025. All izz well!
Connect on various social media platforms here
May’25 review of our equity research strategy- Emerging leaders [Visit www.fintrekkcapital.com for subscription details]
Subscribe (free) to #AKGweekendreadings here [Newletter released every Friday]
Disclaimer : This newsletter is for information and educational purposes only. In this material, Amit Kumar Gupta (SEBI registered Research Analyst, INH100009327) has used information that is publicly available and is believed to be from reliable sources. While utmost care has been exercised, the author does not warrant the completeness or accuracy of the information and disclaims all liabilities, losses and damages arising out of the use of this information. Readers, before acting on any information herein should make their own investigation & seek appropriate professional advice. Any sector(s)/ stock(s)/ issuer(s) mentioned do not constitute any recommendation and the RA may or may not have any future or existing position in these. All opinions/ figures/ charts/ graphs are as on date of publishing (or as at mentioned date) and are subject to change without notice. Any logos used may be trademarks™ or registered® trademarks of their respective holders, our usage does not imply any affiliation with or endorsement by them. Past performance on charts may or may not be sustained in the future and should not be used as a basis for comparison to infer any investment idea