
AKG Weekly Charts - Issue #93
AKG Weekly Charts - Issue #93
This newsletter is a weekly selection of 10 charts hand-picked across the internet which pertains to our investment strategy and bring an updated insight and perspective.

For investing with us, refer details here and here. Use discount code 'FCSPLASH' to get a 20% discount across all plans and strategies on smallcase.
For more OTT and Book recommendations every weekend, follow #FCOTTReco and #FCBookReco on our Twitter page here
Connect on various social media platforms here
Subscribe to (free) AKG weekend readings newsletter here
Summary of last week in financial markets here
Interview with News9 on luxury housing and Patanjali Foods [LINK]
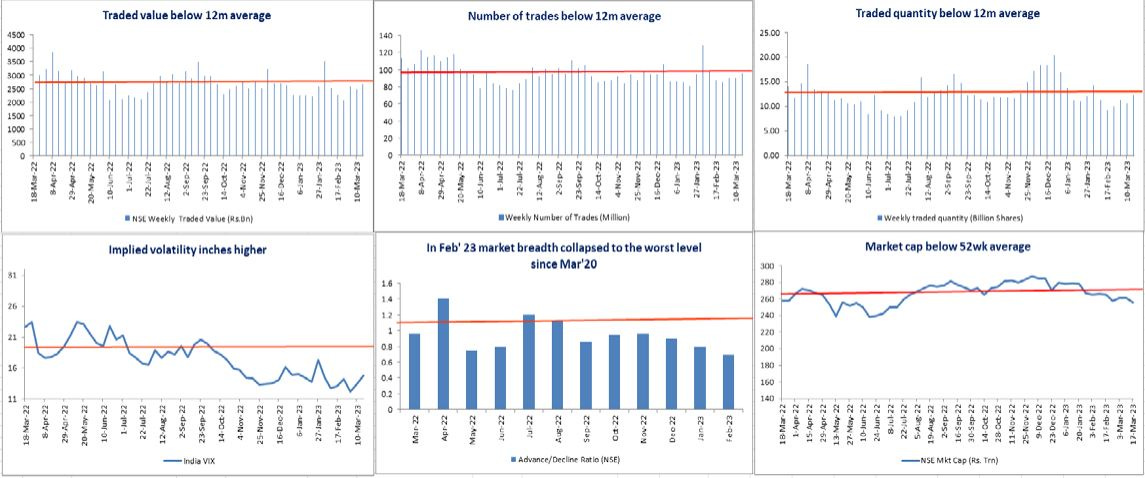
[1] The breadth of the market has completely collapsed in last year. SIP stoppage ratio is at 27-month high. “Multibagger” google searches are back to 2019 lows. Turnover in option trading is at all-time high waiting for a black swan impact. Sentiment still neutral and no signs of climax. Interesting times ahead!
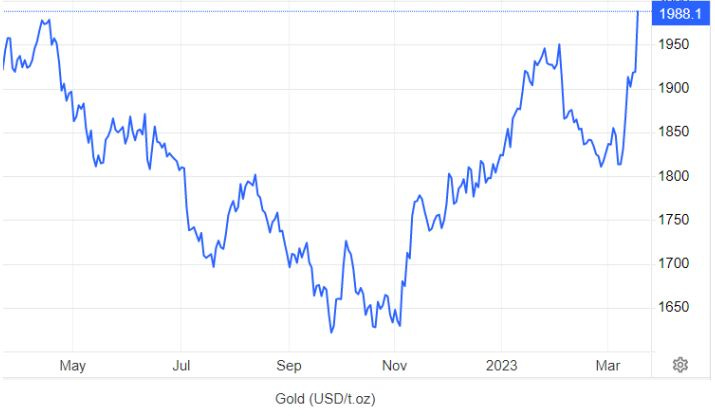
[2] Gold acting as safe heaven and now at 52w highs, thanks to banking crisis in US and Europe. Five months ago (see here), we had highlighted the likelihood of a trading opportunity emerging in gold. The opportunity did present itself, though not exactly in the manner we had anticipated. Nonetheless, the gold prices rallied about 21% in USD terms; from a low of USD1630/oz in early November to a high of USD1950/oz in March. The short term trading opportunity is likely over in our view with banking crisis finding a footing.
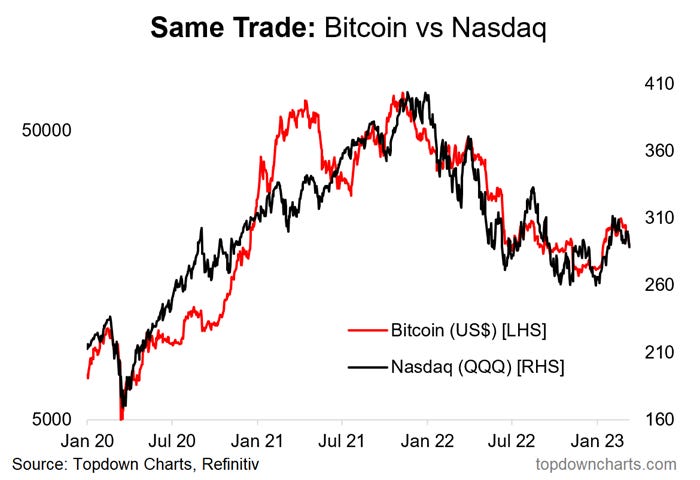
[3] The Bitcoin and NASDAQ coorelation is fascinating across bull and bear markets. Obviously, the chart below ignores the elevated volatility within the cryptocurrency market, one which requires particular cash administration abilities from crypto retail merchants.
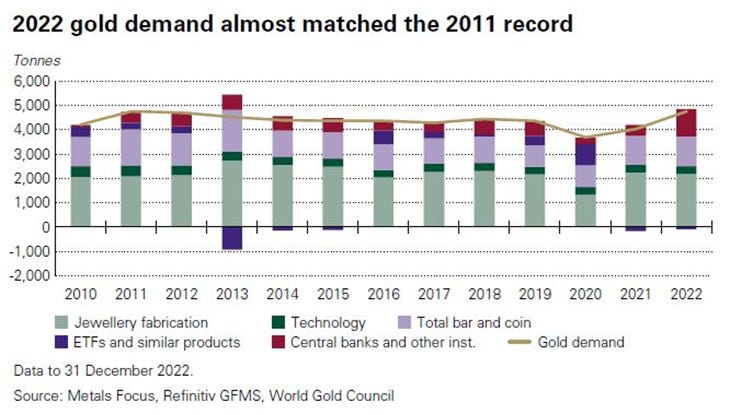
[4] In the post GFC period central banks have been a major driver of the global gold demand. The banks which were net sellers of gold in the 1992-2008 period, turned net buyers of yellow metal, buying close to ~1200tonne in 2022. Apparently, the unprecedented money printing prompted the global central bankers to diversify their reserves away from USD and EUR.
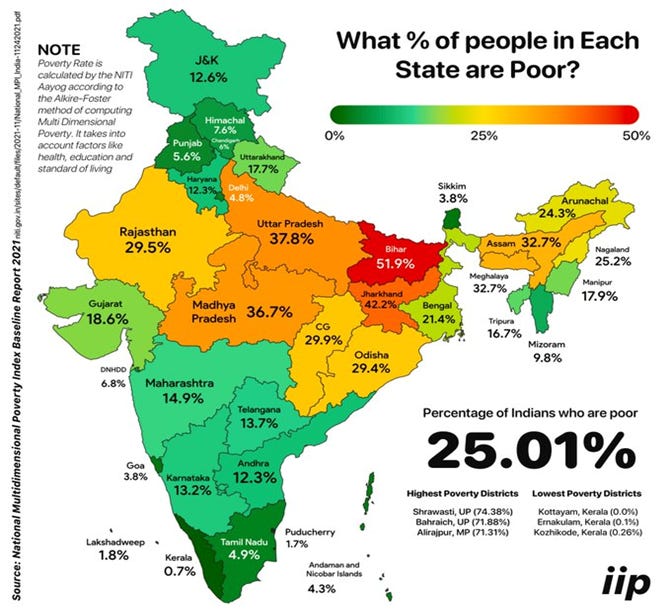
[5] As per the latest NITI Aayog data, in Bihar 52% of the state’s population is poor; while Tamil Nadu has just 5% of its population below poverty line. MP has 37% of its population living below the poverty line. In fact the most populated four states – Bihar, UP and MP have the largest number of poor living in poverty. There is no doubt that there exists massive inequality in terms of income, wealth, access to good education & healthcare and growth opportunities in India
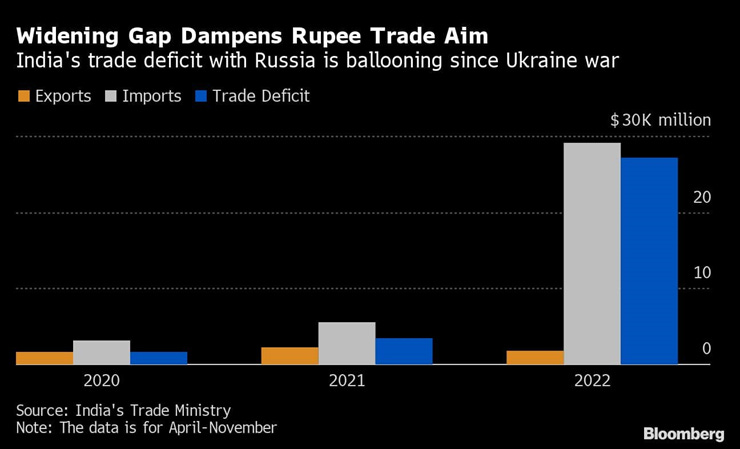
[6] The trade deficit with Russia continues to balloon in the light of “$2 cheaper” crude from Russia. We can all complaint about not saving enough from fuel!
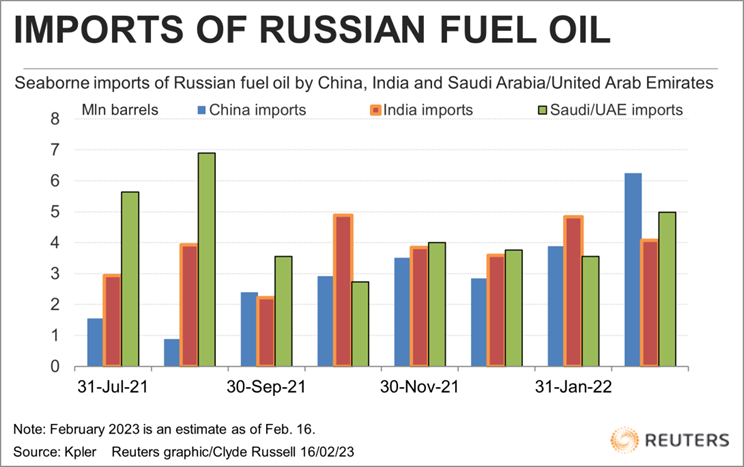
[7] The trend continues in 2023…India continues to benefit from cheaper oil imports from Russia
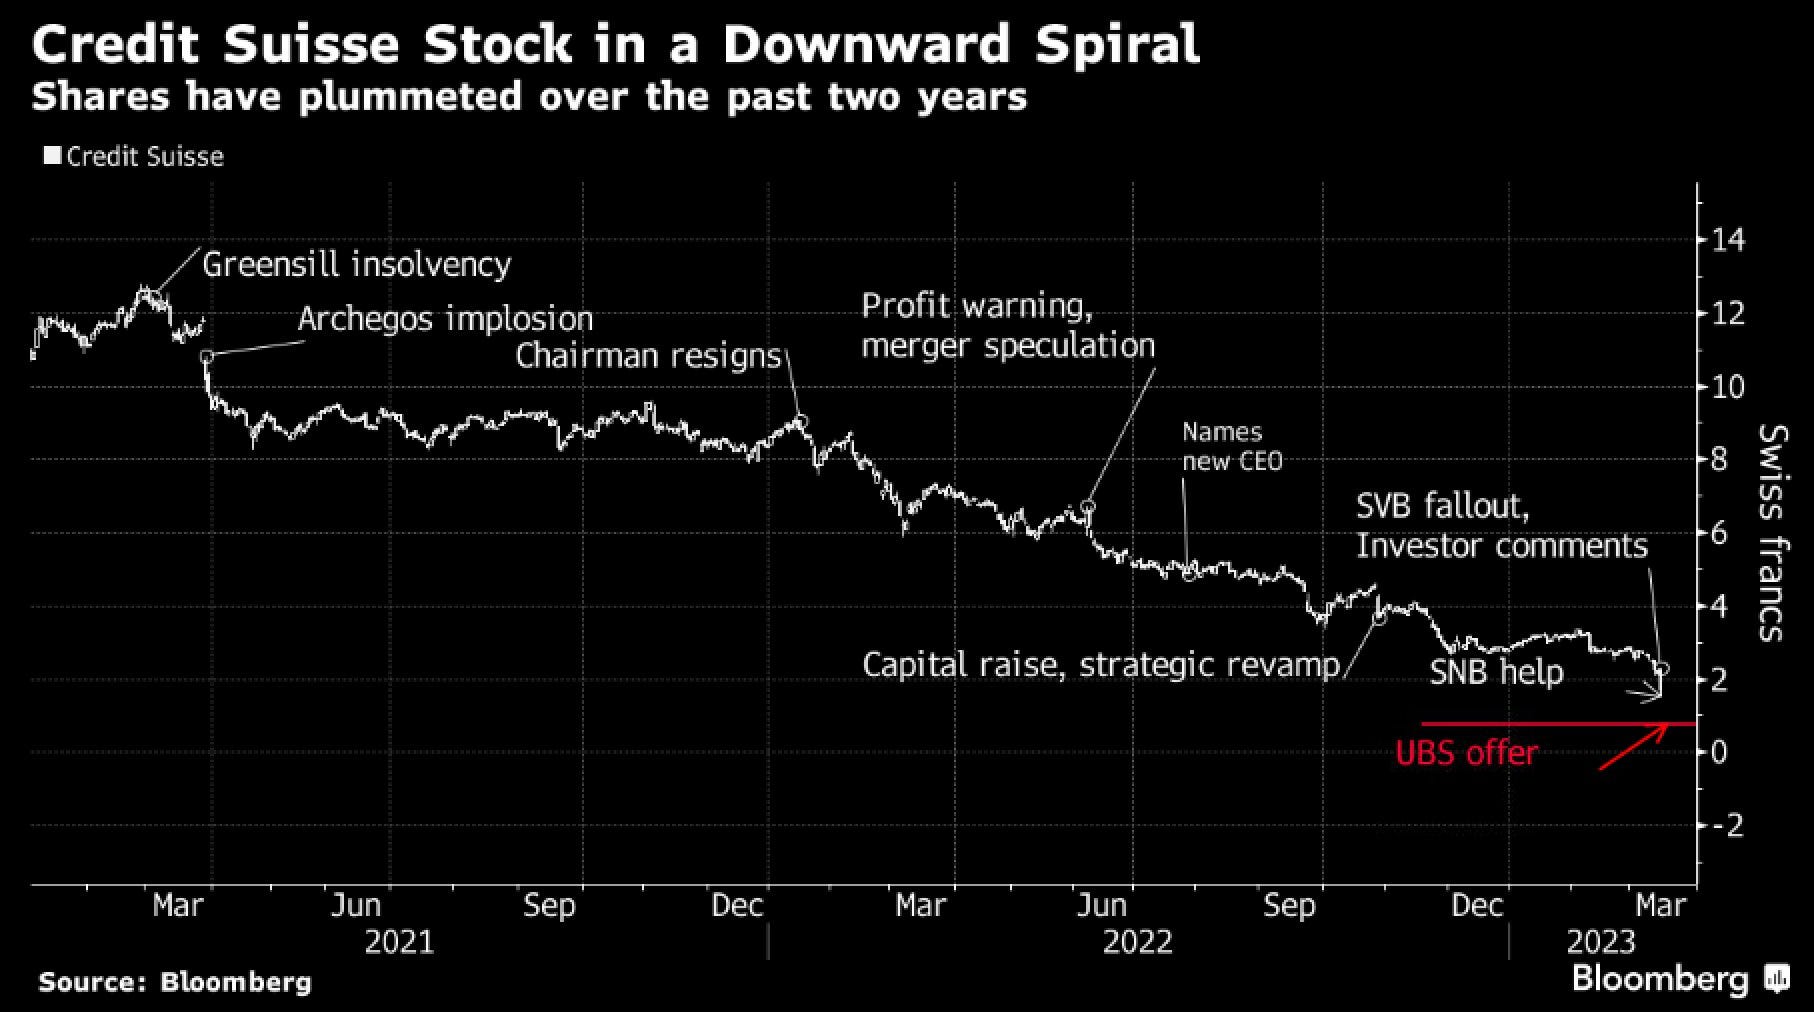
[8] An emergency ordinance, a govt backstop, and shareholders coming out better than some bondholders is all part of Credit Sussie bailout by UBS. That Achegos implosion of 5bn$ started the recent spiral. An end of an era!
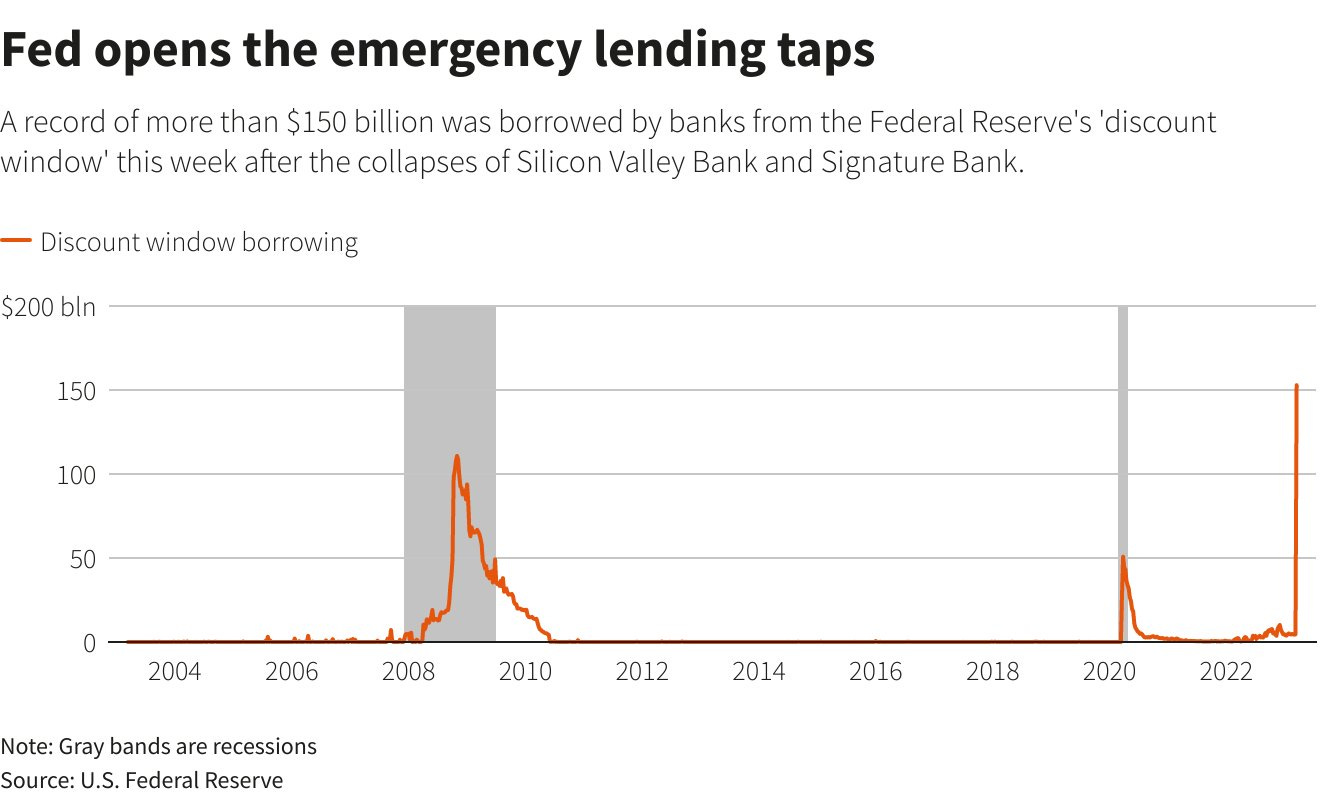
[9] One of the most shared charts in last week. Panic at the discount window? This chart highlights how great the fear of the banks really is. Banks rush to borrow record-breaking $150bn from Fed's discount window, topping even a record set during the 2008 financial crisis, after the collapses of Silicon Valley Bank and Signature Bank. Interestingly, Fed balance sheet jumped by $297bn, largest weekly increase since pandemic. Rate hike to curb inflation and QE to increase inflation!
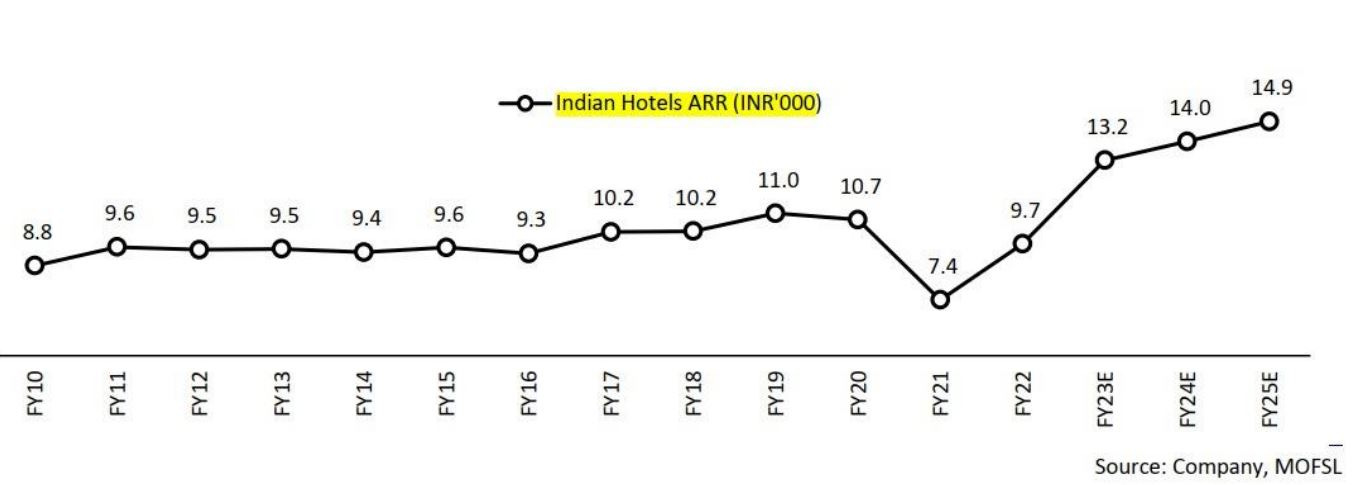
[10] Hotel ARR likely to increase given the supply demand mismatch in the post Covid world. 20% TCS on international trips from 1st April, 2023 will also boost domestic tourism and hotels.
Disclaimer:
This newsletter is for information purposes only. In this material, Amit Kumar Gupta (SEBI registered Research Analyst, INH100009327) has used information that is publicly available and is believed to be from reliable sources. While utmost care has been exercised, the author does not warrant the completeness or accuracy of the information and disclaims all liabilities, losses and damages arising out of the use of this information. Readers, before acting on any information herein should make their own investigation & seek appropriate professional advice. Any sector(s)/ stock(s)/ issuer(s) mentioned do not constitute any recommendation and the RA may or may not have any future position in these. All opinions/ figures/ charts/ graphs are as on date of publishing (or as at mentioned date) and are subject to change without notice. Any logos used may be trademarks™ or registered® trademarks of their respective holders, our usage does not imply any affiliation with or endorsement by them. Past performance may or may not be sustained in the future and should not be used as a basis for comparison to infer any investment ideas.